Bay Area Market Analysis
San Francisco Is Still Asking 2020 Prices. Buyers Are Paying 2026 Prices.

Reviewed by:

Head Agent, California · CalDRE #01997822
The median Sunset District house listed for $1,395,000 in 2020. In 2026, the median Sunset listing was the same $1,395,000. It sold for $1,953,000.
TurboHome Market Analysis · San Francisco · Published November 12, 2026
The short answer: San Francisco list prices per square foot have barely moved since 2020, up 2.0%, while sale prices per square foot rose 21.5%. The gap grew from $64 to $257 per square foot. List prices are anchored to a market that no longer exists, so translate them before you shop. On a $2 million budget, search up to about $1.57 million citywide.
It isn’t just the medians. In July, the San Francisco Standard went looking for the most average house in SF and found 1727 31st Avenue in the Sunset: three bedrooms, 1,804 square feet, listed at $1.785 million. Listing records show it sold for $2.45 million in August, about 37% over list. An average house in San Francisco now sells for far more than an average listing says.
The citywide gap: $64 per square foot in 2020, $257 now
We compared median list price per square foot and median sale price per square foot for San Francisco single-family homes sold in 2020 and from January 2 to November 10, 2026.
- List price per square foot: $925 in 2020, $944 in 2026. Up 2.0%.
- Sale price per square foot: $989 in 2020, $1,201 in 2026. Up 21.5%.
In 2020, the typical home sold for $64 per square foot more than it listed for. In 2026, the gap was $257. On an 1,800-square-foot house, that’s about $463,000 between the listing and the closing.
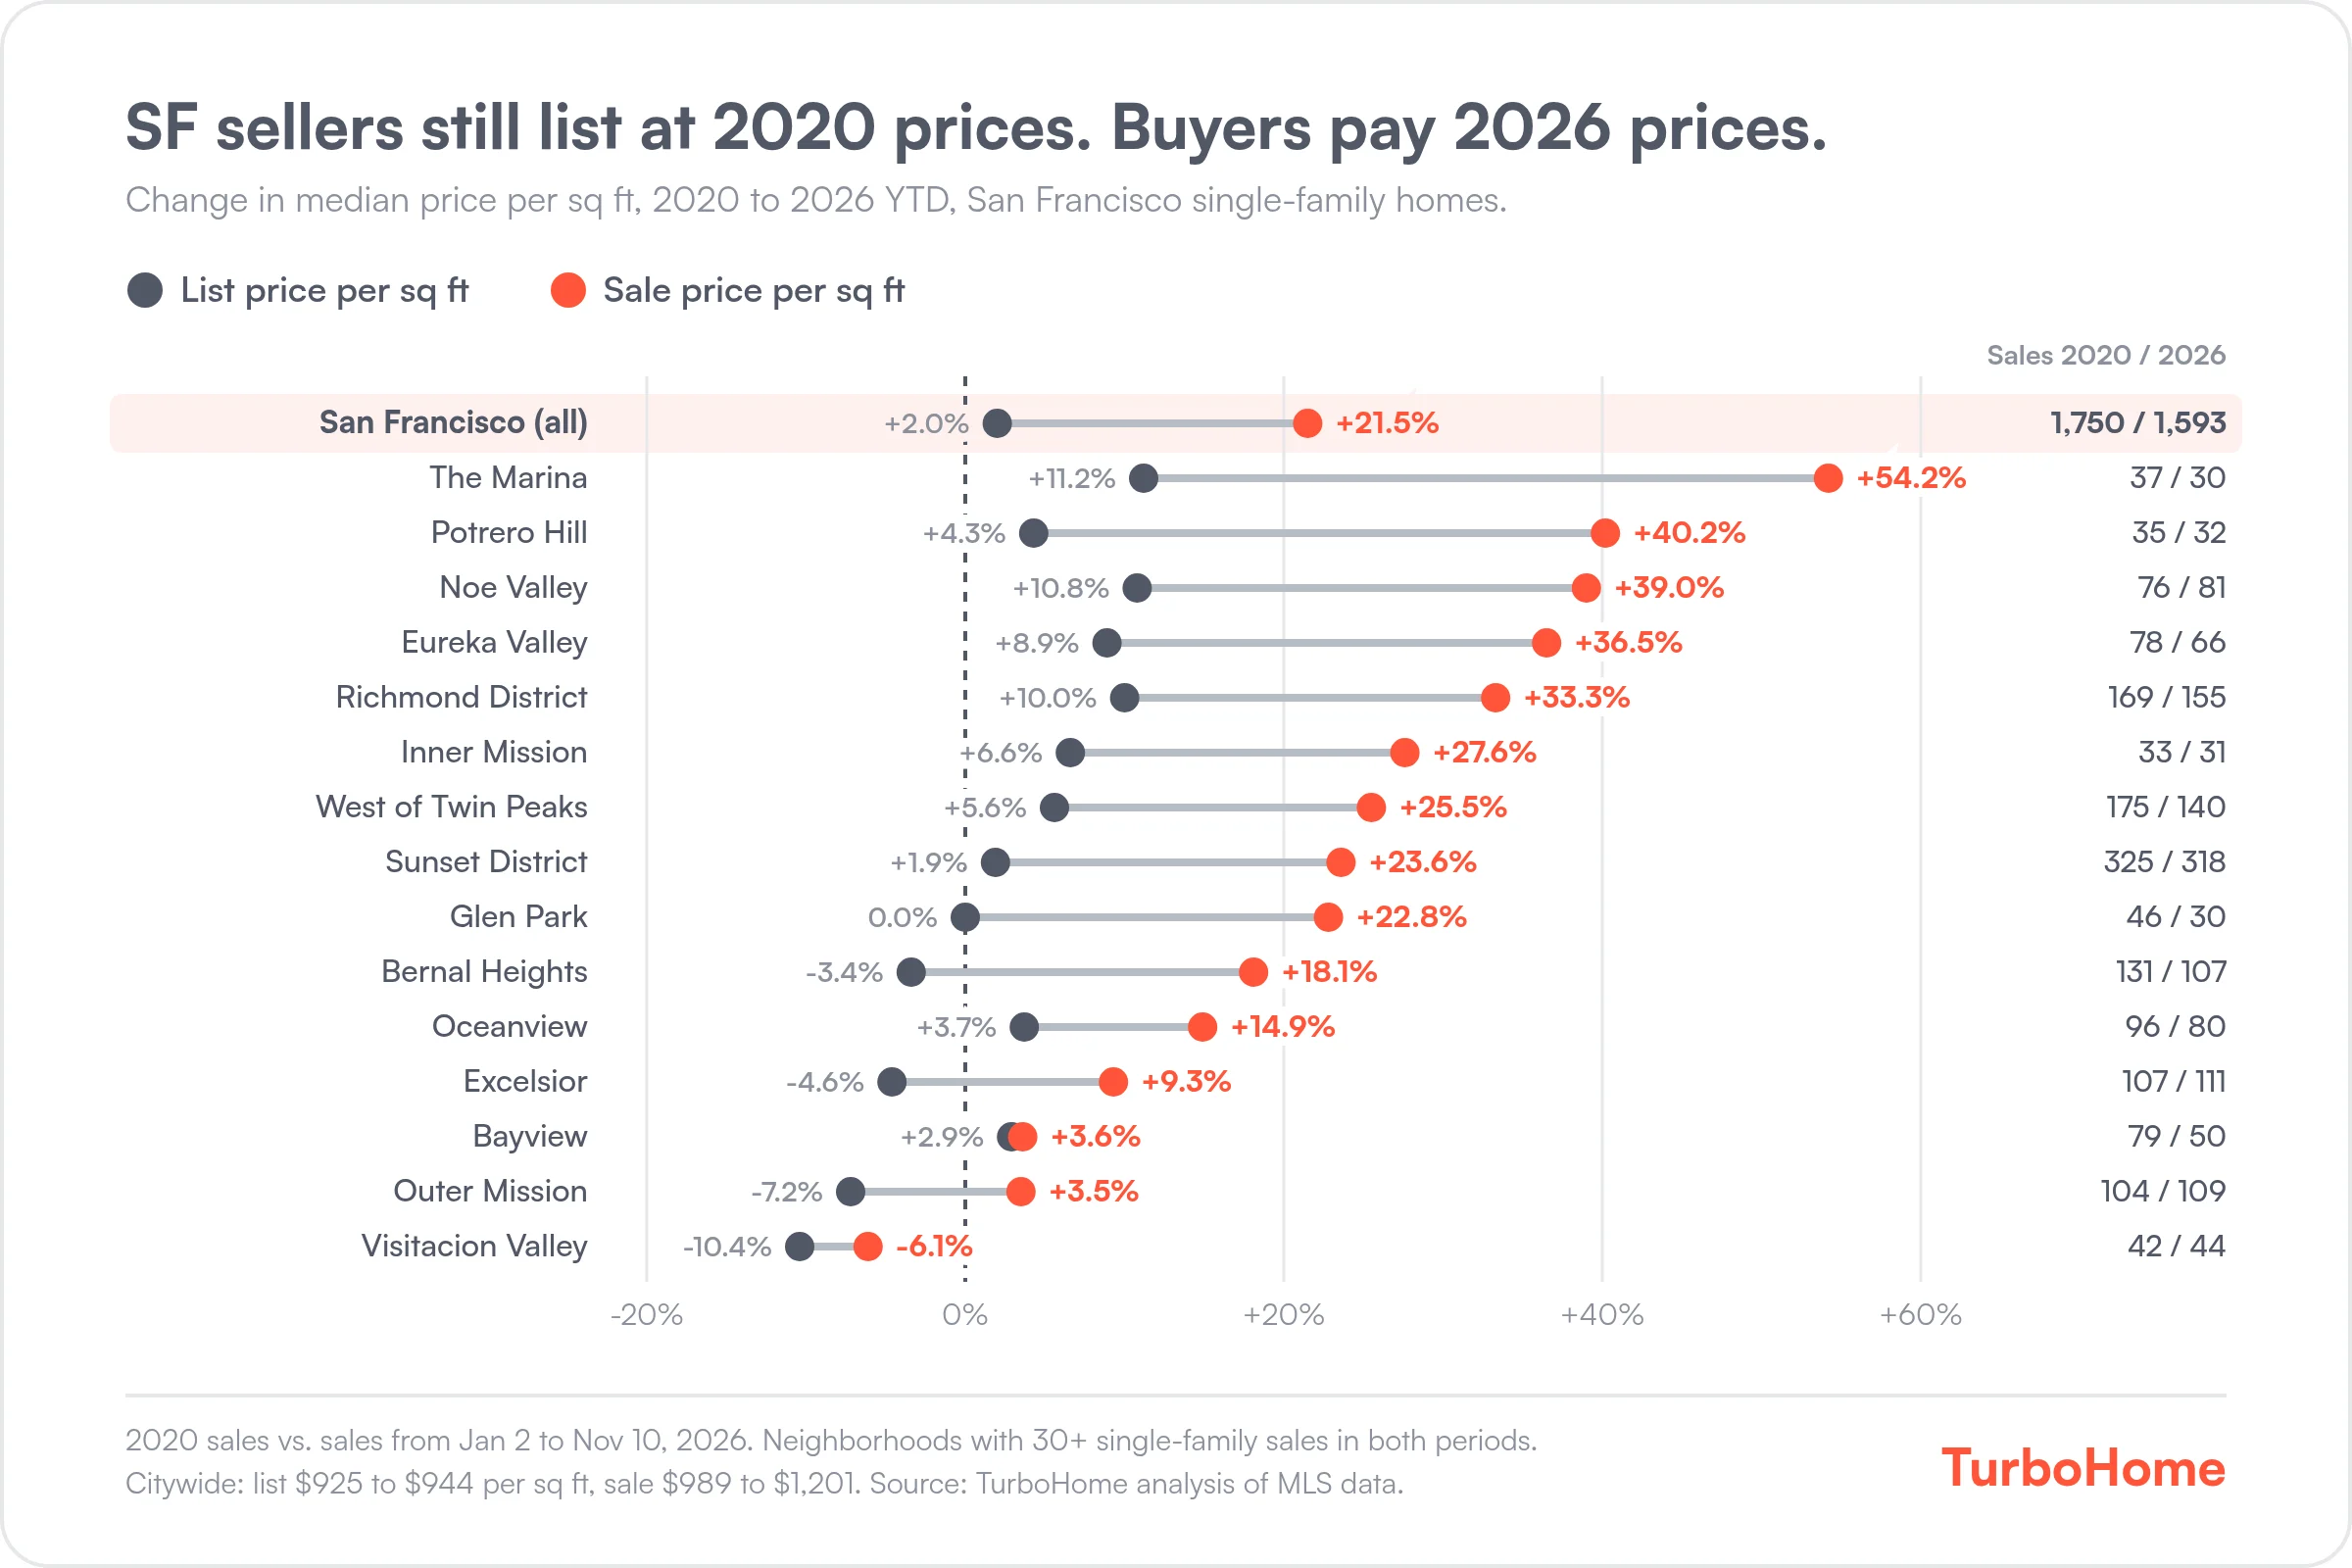
San Francisco home prices by neighborhood
In every neighborhood with enough sales to measure, sale prices per square foot rose faster than list prices. The gap is widest in the central and northern neighborhoods:
- The Marina: list price per square foot up 11.2%, sale price up 54.2%.
- Potrero Hill: list up 4.3%, sale up 40.2%.
- Noe Valley: list up 10.8%, sale up 39.0%.
- Glen Park: list flat at $1,112, sale up 22.8%.
- Bernal Heights: list down 3.4%, sale up 18.1%. Bernal list prices per square foot are lower now than in 2020.
The westside follows the same pattern. Richmond District sale prices per square foot rose 33.3% against a 10.0% rise in list prices. West of Twin Peaks rose 25.5% against 5.6%. In the Sunset, list prices per square foot rose 1.9% and sale prices rose 23.6%.
The southeast is the exception. In Bayview, list and sale prices per square foot rose about the same (2.9% and 3.6%). In Visitacion Valley, both fell (10.4% and 6.1%). Excelsior and Outer Mission list prices fell, while sale prices rose 9.3% and 3.5%.
Why San Francisco list prices froze
Pricing low is a strategy. “In San Francisco, the asking price is a marketing decision, not a valuation,” San Francisco agent Clay Gjevre wrote in September. The San Francisco Chronicle, citing Compass, reported in October that sellers were pricing about a third below market value, auction-style.
Underpricing works when buyers have few alternatives. Gjevre put citywide single-family inventory near one month of supply in July, against about 1.8 months a year earlier. In the Sunset, Kinoko Real Estate measured about 0.7 months of supply for houses in October, and the median house sold for 135% of list price, up from 122% a year earlier.
The result is a list price that tells you little about the final price. In our San Francisco list price analysis, the 2026 list price missed the final sale price of the typical house by a median 25.5%.
How to translate a San Francisco list price
Divide a neighborhood’s median sale price per square foot by its median list price per square foot and you get a rough multiplier. Multiply a list price by it to estimate where homes there have been closing, or divide your budget by it to set a search limit.
| Area | List $/sq ft | Sale $/sq ft | Multiplier | $2M budget |
|---|---|---|---|---|
| San Francisco (all) | $944 | $1,201 | 1.27x | $1.57M |
| The Marina | $1,548 | $2,008 | 1.30x | $1.54M |
| Potrero Hill | $1,092 | $1,485 | 1.36x | $1.47M |
| Noe Valley | $1,378 | $1,819 | 1.32x | $1.52M |
| Eureka Valley | $1,320 | $1,661 | 1.26x | $1.59M |
| Richmond District | $1,012 | $1,289 | 1.27x | $1.57M |
| Inner Mission | $1,027 | $1,244 | 1.21x | $1.65M |
| West of Twin Peaks | $962 | $1,194 | 1.24x | $1.61M |
| Sunset District | $880 | $1,206 | 1.37x | $1.46M |
| Glen Park | $1,112 | $1,430 | 1.29x | $1.56M |
| Bernal Heights | $996 | $1,284 | 1.29x | $1.55M |
| Oceanview | $814 | $968 | 1.19x | $1.68M |
| Excelsior | $728 | $883 | 1.21x | $1.65M |
| Bayview | $662 | $709 | 1.07x | $1.87M |
| Outer Mission | $806 | $1,019 | 1.26x | $1.58M |
| Visitacion Valley | $707 | $779 | 1.10x | $1.82M |
Figures are 2026 medians through November 10. “$2M budget” is the highest list price to search on a $2 million budget ($2 million divided by the multiplier). The multiplier is a ratio of two medians, a rough guide for a neighborhood, not a rule for any one house. Condition, layout, parking and lot still move the price.
For example, a Sunset house listed at $1.5 million translates to about $2.06 million.
What this means for you
If you’re buying
- Set your search filters 20% to 30% below your budget. The table puts the citywide search limit about 21% under a $2 million budget, and the Sunset’s about 27% under.
- Price every offer from closed sales. Find recent sales of similar homes in the same neighborhood, compare them per square foot and adjust for condition, layout, parking and lot. Our San Francisco price per square foot guide and how much over asking homes sell for in San Francisco are good starting points.
- Don’t read a low list price as a deal. In most SF neighborhoods, it’s a starting bid.
- Keep more at closing. With your own agent on your side, a Bay Area buyer rebate can return part of the commission to you. Our commission rebate calculator shows the math.
If you’re still choosing where to look, see the best San Francisco neighborhoods for first-time buyers.
If you’re selling in 2027
- Choose a strategy, not just a number. A list price can be a valuation, the number you expect to get, or a marketing price set to draw a crowd. Either can work. Pick one on purpose.
- Know your 2026 price per square foot. Your neighbors’ list prices may still look like 2020. The sales around you don’t. Start with a free valuation report.
- Check supply before you underprice. Listing low depends on buyers having few alternatives. Look at months of supply in your neighborhood when you set the price.
If you’re investing or analyzing a market
List prices per square foot understate how much San Francisco has appreciated since 2020. To track value, use closed price per square foot. Our teaser list price analysis shows how much of the Bay Area overbid starts with the list price. For more San Francisco data, see San Francisco condo vs. house prices, up-and-coming San Francisco neighborhoods and the San Francisco housing market page.
Methodology notes
- Source: TurboHome analysis of MLS closed-sale records.
- Geography: San Francisco County. Neighborhoods are shown when they had 30 or more single-family sales in both periods.
- Sample: San Francisco single-family home sales in 2020 (1,750 sales) and from January 2 to November 10, 2026 (1,593 sales).
- Price per square foot: List price or sale price divided by living area. Figures are medians for each period.
- Multiplier: The 2026 median sale price per square foot divided by the 2026 median list price per square foot for each area.
- Sunset District medians: The $1,395,000 median list price (2020 and 2026) and $1,953,000 median sale price (2026) cover Sunset District single-family sales.
- MLS attribution: Data in this report is derived from MLS closed-sale records and is provided for informational purposes only. It has not been independently verified by the Multiple Listing Service and may differ from figures published by MLS associations due to differing cutoff dates, cleaning rules, or geographic groupings.
Sources & further reading
- We found the most average house in SF. It just sold for 39% over asking (San Francisco Standard, July 23, 2026): the 1727 31st Avenue listing.
- 1727 31st Ave, San Francisco, CA 94122 (Redfin): the recorded August 2026 sale price.
- Why San Francisco Asking Prices Mean Nothing in 2026 (Clay Gjevre, September 2, 2026): pricing strategy and citywide months of supply.
- Sunset District Real Estate Market Update (Kinoko Real Estate): Sunset sale-to-list ratio and months of supply.
- 9 in 10 S.F. homes are now selling for more than asking — sometimes much more (San Francisco Chronicle, October 26, 2026): Compass data on pricing strategy.
These third-party sources use their own methods and reporting windows and may not match TurboHome’s figures exactly. They are included as context, not as the underlying data for this report.
Frequently asked questions
What is the gap between asking price and sale price in San Francisco?
In 2026 through November 10, the median San Francisco single-family home listed at $944 per square foot and sold at $1,201, a gap of $257 per square foot. In 2020, the gap was $64 ($925 listed, $989 sold). Over that time, list prices per square foot rose 2.0% and sale prices per square foot rose 21.5%.
How much over list price do Sunset District homes sell for?
In TurboHome’s data, the median Sunset District house listed at $1,395,000 in both 2020 and 2026, and in 2026 it sold for $1,953,000. Per square foot, Sunset homes listed at a median $880 and sold at $1,206 in 2026. Kinoko Real Estate’s latest Sunset update puts the median house at 135% of list price, up from 122% a year earlier.
What are Bernal Heights home prices per square foot?
In 2026 through November 10, the median Bernal Heights single-family home listed at $996 per square foot and sold at $1,284. Since 2020, Bernal Heights list prices per square foot fell 3.4% while sale prices per square foot rose 18.1%.
How do I turn a San Francisco list price into a realistic budget?
Divide the neighborhood’s median sale price per square foot by its median list price per square foot to get a rough multiplier, then divide your budget by it to set your search limit. On a $2 million budget, that means searching up to about $1.57 million citywide and about $1.46 million in the Sunset. Then price each offer from recent comparable sales.
Should I list my San Francisco home low to start a bidding war?
Only if you choose that strategy on purpose and the demand is there. Many SF sellers list low to draw multiple offers, and it works when supply is thin. Clay Gjevre put citywide single-family inventory near one month of supply in July 2026. Know what comparable homes sold for per square foot before you pick a list price, whether you list at value or below it.
Get a 2026 price on any SF listing
In a market where list prices are six years stale, the comps are the price. TurboHome agents build every SF offer from closed $/sq ft, and our flat fee means you keep thousands at closing. Ask us for a 2026 price on any SF listing.
About the Author
Lucas Beard
Lucas Beard is COO of TurboHome and holds California DRE license 02417843. His guides reflect TurboHome's buyer-side experience and link to primary sources for regulatory, lender, market, and competitor claims.
View Lucas on LinkedInAbout Kevin Kretzmer
Head Agent, California
Kevin Kretzmer leads TurboHome's California agent team and reviews California and national buyer guidance for practical brokerage accuracy.
View Kevin's profile