Bay Area Market Analysis
Why Older Bay Area Homes Win Bidding Wars Yet Sell for the Same Price per Square Foot as Newer Ones

Reviewed by:

Head Agent, California · CalDRE #01997822
Imagine two Bay Area houses of the same size, standing in the same ZIP code, one built in the 1920s and the other in the 2000s. The older house closes about 10% above its asking price after a round of competing offers, while the newer one settles just below its list price after a quiet negotiation. It is natural to wonder which of the two buyers overpaid.
TurboHome Market Analysis · Bay Area · Published November 5, 2026
The answer is that neither did. In 2026, homes built in the 1920s sold for a median 110.4% of their original asking price and homes built in the 2000s for 99.7%, yet when each sale is measured against same-size homes in its own ZIP, both landed at the going rate per square foot (an index of 100.0 for the 1920s and 97.4 for the 2000s). The bidding war on an older home does not buy a premium; it simply makes up for an asking price that started lower.
What most buyers assume about old and new homes
The familiar story holds that newer homes command a premium for their modern systems and the comfort of fewer surprises, while older homes trade at a discount to account for their quirks, their deferred maintenance and their aging wiring and plumbing. The same questions surface again and again in Bay Area threads on Reddit and Blind, from whether a 1980s house with no upgrades should really cost as much as a new build to whether an old home calls for a maintenance reserve of anywhere from 1% to 10% of its value each year.
The headlines, meanwhile, seem to point in the opposite direction. In September, nearly 92% of San Francisco single-family homes sold above asking, the highest share on record, according to Compass data reported by the San Francisco Chronicle. Watching older homes sell well above their list prices, many buyers reasonably conclude that the market pays extra for character and charm.
Both stories rest on the same assumption, which is that a list price tells you something reliable about a home’s value. As the data below shows, it does not, and the unadjusted numbers only deepen the confusion.
How the raw numbers mislead
The place to begin is with the unadjusted medians from 15,015 single-family sales this year in Alameda, Contra Costa, San Mateo and Santa Clara counties.
| Built in the 1920s | Built in the 2000s | |
|---|---|---|
| Median price per sq ft | $793 | $512 |
| Median size | 1,388 sq ft | 2,500 sq ft |
| Price per sq ft vs. same-ZIP, same-size homes | 100.0 | 97.4 |
Judged by raw price per square foot, homes from the 1920s sell for 55% more than homes from the 2000s, which looks at first like a substantial premium for vintage. On closer inspection, that gap has little to do with age and almost everything to do with size and location.
The median 2000s home is 80% larger than its 1920s counterpart, at 2,500 square feet against 1,388, and larger homes nearly always sell for less per square foot because the cost of the lot, the kitchen and the bathrooms is spread across more space. Much of the 2000s housing stock was also built in the outer suburbs, at some distance from the older neighborhoods where most 1920s homes stand. A comparison of raw medians therefore sets a small house in a pricier ZIP against a large house in a less expensive one, and once homes of the same size in the same ZIP are lined up side by side, the 55% gap disappears.
A like-for-like comparison across 13 decades
To remove the effects of size and location, we compared each sale’s price per square foot with the median for same-size homes in the same ZIP code. On this scale, an index of 100 means a home sold at the going rate for its neighborhood and size, while an index of 97.4 means it sold 2.6% below that rate.
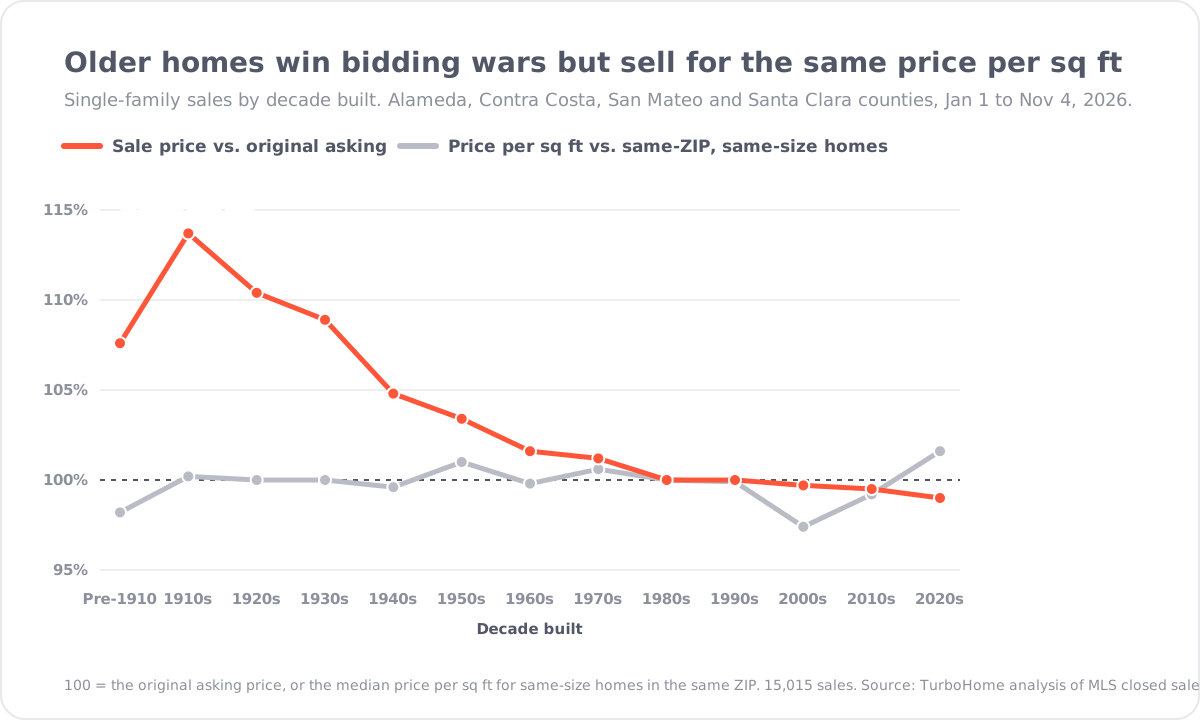
The two lines in the chart describe very different things. The grey line, which tracks price per square foot against same-size neighbors, barely moves across more than a century of construction, staying between 97.4 and 101.6 from pre-1910 homes through 2020s builds and resting at exactly 100.0 for the 1920s. Sales from 2025 trace the same flat pattern. The orange line, which tracks the sale price against the original asking price, tells another story entirely: it peaks at 113.7% for homes built in the 1910s, holds at 110.4% for the 1920s and then declines steadily to 99.0% for 2020s builds, a fall of 14.7 points.
In other words, buyers pay roughly the same amount per square foot for a 100-year-old house as they do for one built 20 years ago. What differs is the route they take to reach that price, which for an older home usually runs through a bidding war and for a newer home through a negotiation down from the asking price.
The full breakdown by decade appears below.
| Decade built | Sales | $/sq ft vs. same-ZIP, same-size homes | Median sale vs. original asking | Sold 10%+ over asking |
|---|---|---|---|---|
| Pre-1910 | 290 | 98.2 | 107.6% | 46.9% |
| 1910s | 452 | 100.2 | 113.7% | 55.5% |
| 1920s | 960 | 100.0 | 110.4% | 51.5% |
| 1930s | 466 | 100.0 | 108.9% | 47.9% |
| 1940s | 1,316 | 99.6 | 104.8% | 34.4% |
| 1950s | 3,015 | 101.0 | 103.4% | 27.6% |
| 1960s | 2,514 | 99.8 | 101.6% | 19.9% |
| 1970s | 1,859 | 100.6 | 101.2% | 15.9% |
| 1980s | 1,058 | 100.0 | 100.0% | 8.4% |
| 1990s | 1,175 | 99.9 | 100.0% | 9.5% |
| 2000s | 922 | 97.4 | 99.7% | 6.1% |
| 2010s | 561 | 99.2 | 99.5% | 6.2% |
| 2020s | 427 | 101.6 | 99.0% | 5.9% |
It is worth noting where the lowest reading falls. At 97.4, homes built in the 2000s sold for less per square foot than homes from any other decade, which is the opposite of what a new-home premium would predict.
Why older homes attract bidding wars
If old and new homes finish at the same price per square foot, the large overbids on older homes must come from somewhere other than the homes themselves, and the most likely source is the asking price.
| Built in the 1920s | Built in the 2000s | |
|---|---|---|
| Median sale vs. original asking | 110.4% | 99.7% |
| Sold 10% or more over original asking | 51.5% | 6.1% |
| Closed below original asking | 21.6% | 50.8% |
Just over half of 1920s homes sold for at least 10% more than their original asking price, while just over half of 2000s homes closed below theirs. Because both groups ended at about the same price per square foot, the older homes must have started from asking prices that sat lower relative to their value, and the bidding simply closed that gap. Seen this way, the overbid on an older home is a pricing convention rather than a premium.
This is consistent with our earlier analysis of teaser pricing, which found that much of the Bay Area’s famous overbidding begins with a list price set deliberately below the market.
The gap between old and new is also growing. Homes built in the 1910s sold for a median 105.4% of their original asking price in 2025 and 113.7% in 2026, while homes built in the 2000s barely moved, rising from 99.3% to 99.7%. Since price per square foot stayed flat across decades in both years, the widening gap points to lower asking prices on older homes rather than a growing premium for age.
What the findings mean for you
For buyers, price per square foot matters more than the asking price
A 1920s bungalow listed at $1.4 million will likely close near $1.55 million, in line with the 1920s median of 110.4% of original asking, while a 2000s house listed at the same $1.4 million will likely close at or below its list price. The two listings may show the same figure, but the final prices are unlikely to match.
The most dependable way to compare homes is to measure each one’s price per square foot against same-size homes in the same ZIP, setting the list price aside; our step-by-step guide to building an offer from comparable sales walks through the calculation. It also pays to budget separately for the repairs an older home may need. Because the market does not discount older homes per square foot for their roofs, wiring or plumbing, a buyer pays the going rate and then covers that work on top of it, so the cost of repairs is best estimated after inspection and before an offer is written. Finally, the size of the overbid is a poor guide to whether a buyer paid too much. A 10% overbid on an older home can still be a market-rate purchase, just as a sale at list price on a newer home is not necessarily a bargain, since both tend to finish near the going rate per square foot.
For sellers of older homes, the list price shapes the path rather than the result
An overbid on an older home is not additional money, because the sale tends to finish near the same price per square foot whatever the list price. The real decision is about how to reach that number, whether through a lower list price that invites a bidding war or through a price closer to value that leads to a shorter negotiation.
Whichever approach a seller chooses, timing still matters. Our analysis of the 15-day cliff found that Bay Area homes earn their premium within their first two weeks on the market.
For sellers of newer homes, accurate pricing from the first day matters most
Owners of newer homes should not expect a bidding war to lift their price. In 2026, 50.8% of homes built in the 2000s closed below their original asking price and only 6.1% sold for 10% or more above it. Homes built in the 2020s also took longer to sell, with a median of 27 days on the market, roughly twice the 13 days for 1920s homes. The strongest strategy is to price at the level of comparable same-size homes in the same ZIP from the first day, rather than testing the market and adjusting later.
For investors, there is no charm premium to capture
The so-called historic charm premium does not appear once prices are measured per square foot. The value-add opportunity in older housing stock comes from adding square footage or improving condition, rather than from age itself.
For more Bay Area data, see our California market updates by county and city, our city-by-city guide to how much over asking homes sell for and our comparisons of new construction and resale prices.
Methodology notes
- Source: TurboHome analysis of MLS closed sales.
- Geography: Alameda, Contra Costa, San Mateo and Santa Clara counties, with San Francisco excluded.
- Date range: Closings from January 1 to November 4, 2026, with the 2025 comparison drawn from 2025 closings.
- Sample size: 15,015 single-family sales in 2026.
- Groups: Sales are grouped by the decade in which the home was built, from pre-1910 through the 2020s, where the 2020s group covers homes built from 2020 to 2026.
- Metrics: All figures are medians. Sale-to-list, “sold 10%+ over asking” and “closed below asking” are measured against the original list price, so any price cuts count against the sale. The price per square foot index divides each home’s sale price per square foot by the median for same-size homes in the same ZIP code, so that 100 represents the going rate.
- Caveats: The index controls for location and size but not for condition, layout, lot size or views, so older and newer homes may differ in ways it cannot capture. Decades with fewer sales, such as pre-1910 (290 sales) and the 2020s (427 sales), rest on smaller samples, and off-MLS sales are excluded.
- MLS attribution: Data in this report is derived from MLS closed-sale records and is provided for informational purposes only. It has not been independently verified by the Multiple Listing Service and may differ from figures published by MLS associations due to differing cutoff dates, cleaning rules, or geographic groupings.
Sources & further reading
- 9 in 10 S.F. homes are now selling for more than asking — sometimes much more (San Francisco Chronicle, October 26, 2026): Compass data on the share of San Francisco single-family homes sold above asking in September.
This third-party source uses its own methods and reporting window and may not match TurboHome’s figures exactly. It is included as context, not as the underlying data for this report.
Frequently asked questions
Do new homes sell for more per square foot than old homes in the Bay Area?
No. In TurboHome’s analysis of 15,015 single-family sales in Alameda, Contra Costa, San Mateo and Santa Clara counties from January 1 to November 4, 2026, price per square foot measured against same-size homes in the same ZIP stayed between 97.4 and 101.6 for every build decade from pre-1910 through the 2020s. Homes built in the 1920s sold at an index of 100.0 and homes built in the 2000s at 97.4, and 2025 sales follow the same pattern.
Why do older Bay Area homes sell so far over asking?
Older homes tend to be listed lower relative to their value, and the bidding makes up the difference. In 2026, 51.5% of 1920s homes sold for 10% or more over their original asking price, compared with 6.1% of 2000s homes, yet both groups closed at about the same price per square foot as same-size homes in their ZIP. The overbid reflects a lower starting price rather than a premium for age.
Should I buy an older home or new construction in the Bay Area?
Compare the two on price per square foot against same-size homes in the same ZIP rather than on list price. Because the market prices old and new homes at about the same rate per square foot and offers no discount for an older home’s repairs, budget for that work on top of the purchase price.
How much over asking do older Bay Area homes sell for?
In 2026, homes built in the 1910s sold for a median 113.7% of their original asking price and 1920s homes for 110.4%, compared with 99.7% for 2000s homes and 99.0% for 2020s homes. The most reliable way to set an offer is from recent sales of same-size homes in the same ZIP, rather than from a percentage over asking.
Work with an agent who prices every offer from comparable sales
Whether you’re bidding on a 1920s bungalow or a 2010s build, the price per square foot ends up in the same place, so the commission shouldn’t be the variable. TurboHome agents pull ZIP-and-size comps on every offer, and our flat-fee model returns a buyer rebate at closing instead of charging a percentage of a price you already overbid.
About the Author
Lucas Beard
Lucas Beard is COO of TurboHome and holds California DRE license 02417843. His guides reflect TurboHome's buyer-side experience and link to primary sources for regulatory, lender, market, and competitor claims.
View Lucas on LinkedInAbout Kevin Kretzmer
Head Agent, California
Kevin Kretzmer leads TurboHome's California agent team and reviews California and national buyer guidance for practical brokerage accuracy.
View Kevin's profile