Bay Area Market Analysis
The 15-Day Cliff: Why Bay Area Homes Lose 9 Points of Price After Two Weeks

By Lucas Beard
COO, TurboHome · Last updated November 3, 2026
Reviewed by:

Head Agent, California · CalDRE #01997822
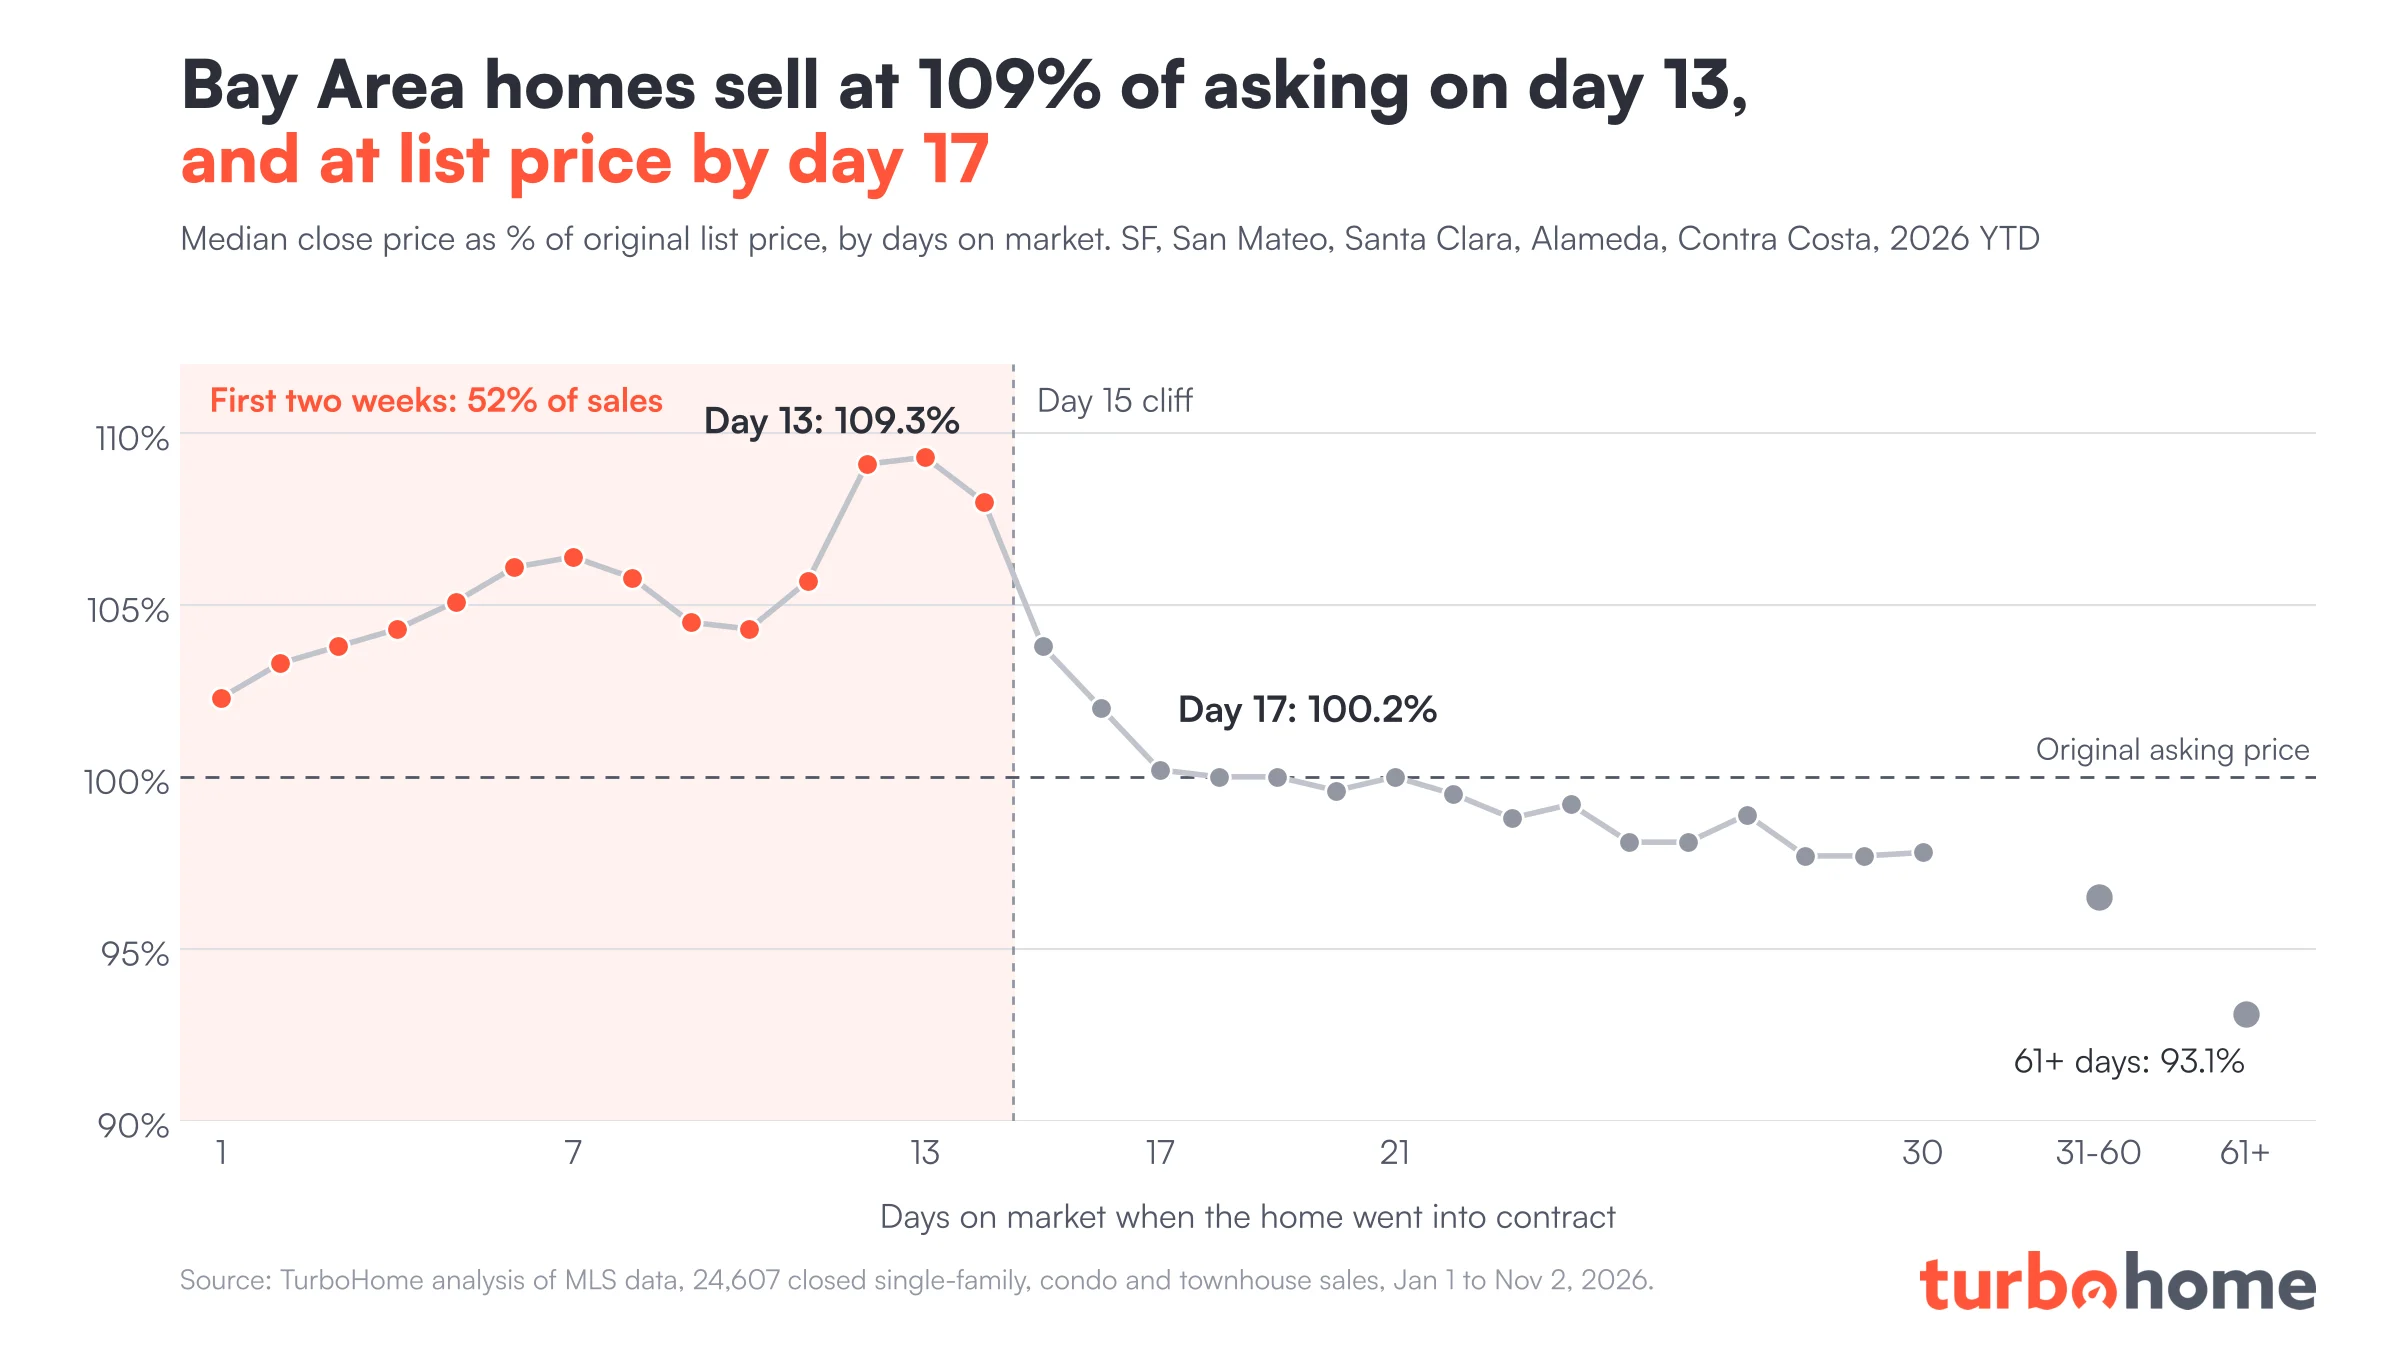
A Bay Area home that goes into contract on day 13 sells for a median 109.3% of its original asking price. One that goes into contract on day 17 sells for 100.2%. Same region, same year, four days apart, and a 9-point drop.
TurboHome Market Analysis · Bay Area · Published November 3, 2026
The takeaway up front: in the Bay Area, your home’s price is set in its first two weeks. Price to win the offer date, not to test the market, because the market stops paying a premium on day 15.
The conventional wisdom has two halves, and the data breaks both. Sellers think “list high, you can always cut later.” Buyers think “if it sits, I can get a deal.” In reality, the price a home gets is mostly decided in its first two weeks, and the cliff after day 14 is steep, not gradual.
Half the Bay Area market sells in two weeks
We looked at 24,607 closed single-family, condo and townhouse sales in San Francisco, San Mateo, Santa Clara, Alameda and Contra Costa counties from January 1 to November 2, 2026. For each sale, we measured the close price against the original list price and grouped sales by how many days the home was on the market when it went into contract.
The chart at the top of this page shows the result. The premium builds to an offer-date peak on days 12 to 14, then falls 9 points by day 17 and never comes back.
| Days on market | Share of sales | Median sale-to-list | Also |
|---|---|---|---|
| 1 to 14 days | 52.0% | 105.9% | 80.3% sold over ask |
| 15 to 30 days | 19.8% | 100.0% | 45.1% sold over ask |
| 31+ days | 28.3% | 95.2% | 56.3% had a price cut |
Three things stand out.
- Half the market moves fast. 52.0% of 2026 sales went into contract within 14 days, at a median 105.9% of original list. Four in five of them closed above the original asking price.
- Days 15 to 30 sell at exactly list. The median was 100.0% of original ask, and only 45.1% of these homes closed above it.
- Past day 30, sellers pay for it. The median was 95.2% of original list, 56.3% of these homes had at least one price cut, and the median seller closed $45,000 under the original ask.
”But slow homes are just worse homes”
The obvious objection is that homes that sit are different homes. Maybe they are cheaper, in weaker locations, or in worse shape, and the market is simply pricing that in.
To test it, we compared each sale’s price per square foot with the 2026 median price per square foot for its own ZIP code and property type. That controls for location and for the difference between a condo and a house.
The gap holds. Homes that went into contract in 1 to 14 days closed at 103.7% of their local benchmark. Homes that took 31 days or more closed at 94.9%. That is nearly 9 points on a like-for-like basis, the same size as the gap in sale-to-list.
This doesn’t mean condition is irrelevant. A home that needs work, has an awkward layout or backs onto a freeway will take longer to sell, and our location control can’t see those things. Pricing strategy and condition both play a role. But “it’s just cheaper homes sitting longer” doesn’t explain the cliff.
The preemptive-offer trap
If speed is good, is the fastest sale the best sale? The data says no.
Homes that went into contract on days 1 to 3, which are typically preemptive offers made before the seller’s scheduled offer date, sold for a median 102.3% to 103.8% of original ask. Homes that went into contract on days 12 to 14 sold for 108.0% to 109.3%.
Days 12 to 14 are when offer dates usually land. A common Bay Area pattern is to list the home, market it for a week, hold open houses over two weekends, and then review all offers at once. That structure gives every interested buyer time to see the home, line up financing and compete on the same day. Competition is what pushes the price up.
A preemptive offer skips that competition. The buyer is paying for certainty and for keeping other bidders out. Sometimes that trade is worth it to the seller. Some preempts are on homes priced at market, where an offer date wouldn’t have produced much more. But as a default, the numbers favor waiting for the offer date.
County by county: the cliff is sharpest where offer dates rule
The pattern shows up across the region, with local differences.
- Alameda County has the biggest offer-date spike. Homes that went into contract on days 12 to 14 closed at 115.8% of original ask, against 102.9% for days 15 to 21.
- San Francisco holds 123% to 124% of original ask from day 4 through day 14, then drops to 110.2% on days 15 to 21. Even after the cliff, SF homes still sell well over list.
- Santa Clara County peaks earlier, at 106.3% on days 4 to 7, and fades from there.
The common thread is that the first two weeks are when the premium is paid. Where offer dates are the norm, the drop after the offer date is steeper.
This isn’t a 2026 fluke
It’s fair to ask whether 2026 is unusual. San Francisco has been one of the hottest markets in the country this year, and some of that heat is tied to the AI boom.
But the cliff held every year since 2023. Homes that went into contract in 1 to 14 days sold for 105.0% to 106.5% of original list each year. Homes that took 15 days or more sold for 96.5% to 97.4%. The gap stayed between 8.6 and 9.1 points every year.
That consistency points to how Bay Area homes are marketed and sold, not to one hot year. The two-week window is part of the market’s structure.
What sellers should do
Overpricing is not a free option. Missing the first-two-week window costs a median of about 9 points of sale-to-list (105.9% down to 95.2%) and about 9 points against local price per square foot. On a $1.4M home, that’s roughly $120,000 to $130,000.
- Price to the comps. Set the list price from what similar nearby homes actually sold for, so it draws buyers in week one rather than testing a number.
- Plan a week-two offer date. In our data, day 12 to 14 sales beat both day 1 to 3 preempts and anything after day 15.
- Prepare before day 1. Have disclosures, inspections and staging done before the home goes live. Buyers can’t bid with confidence on an offer date if the paperwork isn’t ready.
- Avoid the cut cycle. 56.3% of homes that took more than 30 days had at least one price cut. A cut is the market telling you the first price missed, after the most valuable two weeks are gone.
What buyers should do
Stale listings are where the discounts are, but the discount is mostly the overpricing being unwound. A day-45 listing at 95% of original ask is often priced right, not cheap.
- Target days 15 to 21 to negotiate. The offer-date crowd has moved on, but most sellers haven’t cut yet. Only 7.5% of day 15 to 21 sales had a price cut, against 22.9% for day 22 to 30. That’s the window where a seller is most likely to take a reasonable offer before reducing the price publicly.
- Check comps before you call it a bargain. Homes past 60 days sold for a median 93.1% of original ask. Don’t treat a day-60 listing at 93% as a deal until you’ve checked what similar homes sold for.
- Expect competition in week two. If you love a home on day 5, assume the offer date will be crowded. Our winning offer strategy page covers how to compete.
For investors, days on market is the cleanest real-time read of pricing error. A rising share of 30+ day sales in a ZIP code signals that list prices are running ahead of buyers, before median prices move.
For more Bay Area data, see our analysis of San Francisco condo vs. house prices and the East Bay housing market split between the inner East Bay and the Tri-Valley.
The data by day
Sale-to-list is the median close price divided by the original list price. Relative price per square foot is the median of each sale’s close price per square foot divided by the 2026 median price per square foot for its ZIP code and property type.
| Days on market | Closed sales | Median sale-to-original-list | Median $/sq ft vs. ZIP benchmark |
|---|---|---|---|
| 1 | 228 | 102.3% | 101.7% |
| 2 | 292 | 103.3% | 102.1% |
| 3 | 383 | 103.8% | 104.3% |
| 4 | 603 | 104.3% | 106.3% |
| 5 | 786 | 105.1% | 103.2% |
| 6 | 1,335 | 106.1% | 104.4% |
| 7 | 1,660 | 106.4% | 105.2% |
| 8 | 1,323 | 105.8% | 103.4% |
| 9 | 957 | 104.5% | 103.3% |
| 10 | 766 | 104.3% | 102.0% |
| 11 | 938 | 105.7% | 102.7% |
| 12 | 1,211 | 109.1% | 104.5% |
| 13 | 1,277 | 109.3% | 102.7% |
| 14 | 1,026 | 108.0% | 103.2% |
| 15 | 645 | 103.8% | 99.4% |
| 16 | 423 | 102.0% | 99.7% |
| 17 | 348 | 100.2% | 99.7% |
| 18 | 356 | 100.0% | 99.6% |
| 19 | 336 | 100.0% | 97.1% |
| 20 | 344 | 99.6% | 97.6% |
| 21 | 332 | 100.0% | 98.7% |
| 22 | 274 | 99.5% | 96.5% |
| 23 | 217 | 98.8% | 94.5% |
| 24 | 203 | 99.2% | 99.8% |
| 25 | 231 | 98.1% | 97.8% |
| 26 | 247 | 98.1% | 97.2% |
| 27 | 262 | 98.9% | 96.4% |
| 28 | 240 | 97.7% | 100.0% |
| 29 | 212 | 97.7% | 97.0% |
| 30 | 200 | 97.8% | 96.7% |
| 31-60 | 3,672 | 96.5% | 95.7% |
| 61+ | 3,280 | 93.1% | 94.0% |
Methodology notes
- Source: TurboHome analysis of MLS closed sales.
- Geography: San Francisco, San Mateo, Santa Clara, Alameda and Contra Costa counties.
- Property types: Single-family homes, condominiums and townhouses.
- Date range: Closings from January 1 to November 2, 2026. Year-over-year comparisons cover 2023 through 2026.
- Sample size: 24,607 closed sales.
- Days on market: The number of days the home was on the market when it went into contract.
- Metrics: Medians throughout. Sale-to-list uses the original list price, not the final list price, so price cuts count against the sale. Relative price per square foot compares each sale’s close price per square foot with the 2026 median for the same ZIP code and property type, as a location control.
- Caveats: The ZIP-level benchmark controls for location and property type, not for condition, layout, views or other home-specific features. Daily sample sizes after day 21 are small (200 to 274 sales per day), so single-day readings are noisier than the grouped figures. Off-MLS sales are excluded.
- MLS attribution: Data in this report is derived from MLS closed-sale records and is provided for informational purposes only. It has not been independently verified by the Multiple Listing Service and may differ from figures published by MLS associations due to differing cutoff dates, cleaning rules, or geographic groupings.
Frequently asked questions
How does days on market affect sale price in the Bay Area?
Sharply, and mostly in the first two weeks. In TurboHome’s analysis of 24,607 2026 sales in San Francisco, San Mateo, Santa Clara, Alameda and Contra Costa counties, homes that went into contract within 14 days sold for a median 105.9% of original list price. Homes that went into contract on days 15 to 30 sold for 100.0%, and homes past day 30 sold for 95.2%.
Should I accept a preemptive offer on my Bay Area home?
Not by default. Homes that went into contract on days 1 to 3, which are typically preemptive offers, sold for a median 102.3% to 103.8% of original list price in 2026. Homes that went into contract on days 12 to 14, around a typical offer date, sold for 108.0% to 109.3%. Some preempts are on homes priced at market, so weigh the specific offer against recent comps.
When is the best time to negotiate on a Bay Area listing?
Days 15 to 21. By then most of the offer-date competition is gone, but most sellers have not cut their price yet. Only 7.5% of homes that went into contract on days 15 to 21 had a price cut, compared with 22.9% for days 22 to 30.
Is a Bay Area home that has been on the market for 60 days a bargain?
Not necessarily. Homes that went into contract after 61 or more days sold for a median 93.1% of their original list price, but much of that discount is the original overpricing being unwound. Check recent comparable sales before treating a long-listed home as a deal.
Get the price right in week one
Getting the price right in week one matters more than any negotiation in week six. TurboHome’s flat-fee listing service gives you full-service pricing, prep and offer-date strategy without a percentage commission, so more of that day-13 premium stays with you.
About the Author
Lucas Beard
Lucas Beard is COO of TurboHome and holds California DRE license 02417843. His guides reflect TurboHome's buyer-side experience and link to primary sources for regulatory, lender, market, and competitor claims.
View Lucas on LinkedInAbout Kevin Kretzmer
Head Agent, California
Kevin Kretzmer leads TurboHome's California agent team and reviews California and national buyer guidance for practical brokerage accuracy.
View Kevin's profile