East Bay Market Analysis
The East Bay Housing Market Isn't Flat in 2026. It's Two Markets Moving in Opposite Directions.

Reviewed by:

Head Agent, California · CalDRE #01997822
“East Bay prices are flat” is an average of two markets moving in opposite directions. House prices per square foot in the inner East Bay rose 3.9% this year. In the Tri-Valley, they fell 3.9%.
TurboHome Market Analysis · East Bay · Published November 2, 2026
The takeaway up front: a Tri-Valley square foot cost 19% more than an inner East Bay square foot in 2025. In 2026, it costs 10% more. The premium was cut in half in a single year.
”Flat” is an average of two different markets
The county numbers say nothing much is happening. The median existing single-family home in Alameda County sold for $1,265,000 in September, up 1.2% from a year earlier, and Contra Costa County’s median was $870,000, up 0.1%, according to the California Association of Realtors.
Split the East Bay by commute direction and the picture changes. We pulled every single-family MLS closed sale in Alameda and Contra Costa counties for January through October of 2025 and 2026 and grouped the cities into three corridors:
- Inner East Bay (Oakland, Berkeley, Alameda, El Cerrito, Richmond, San Leandro, Piedmont, Albany and Emeryville): median $/sq ft up 3.9%, from $649 to $674.
- Tri-Valley (Dublin, Pleasanton, San Ramon, Danville and Livermore): down 3.9%, from $773 to $743.
- Tri-Cities (Fremont, Newark and Union City): down 2.0%, from $985 to $965.
That is a 7.8-point spread between two places that share a region name and a county line.
The split, city by city
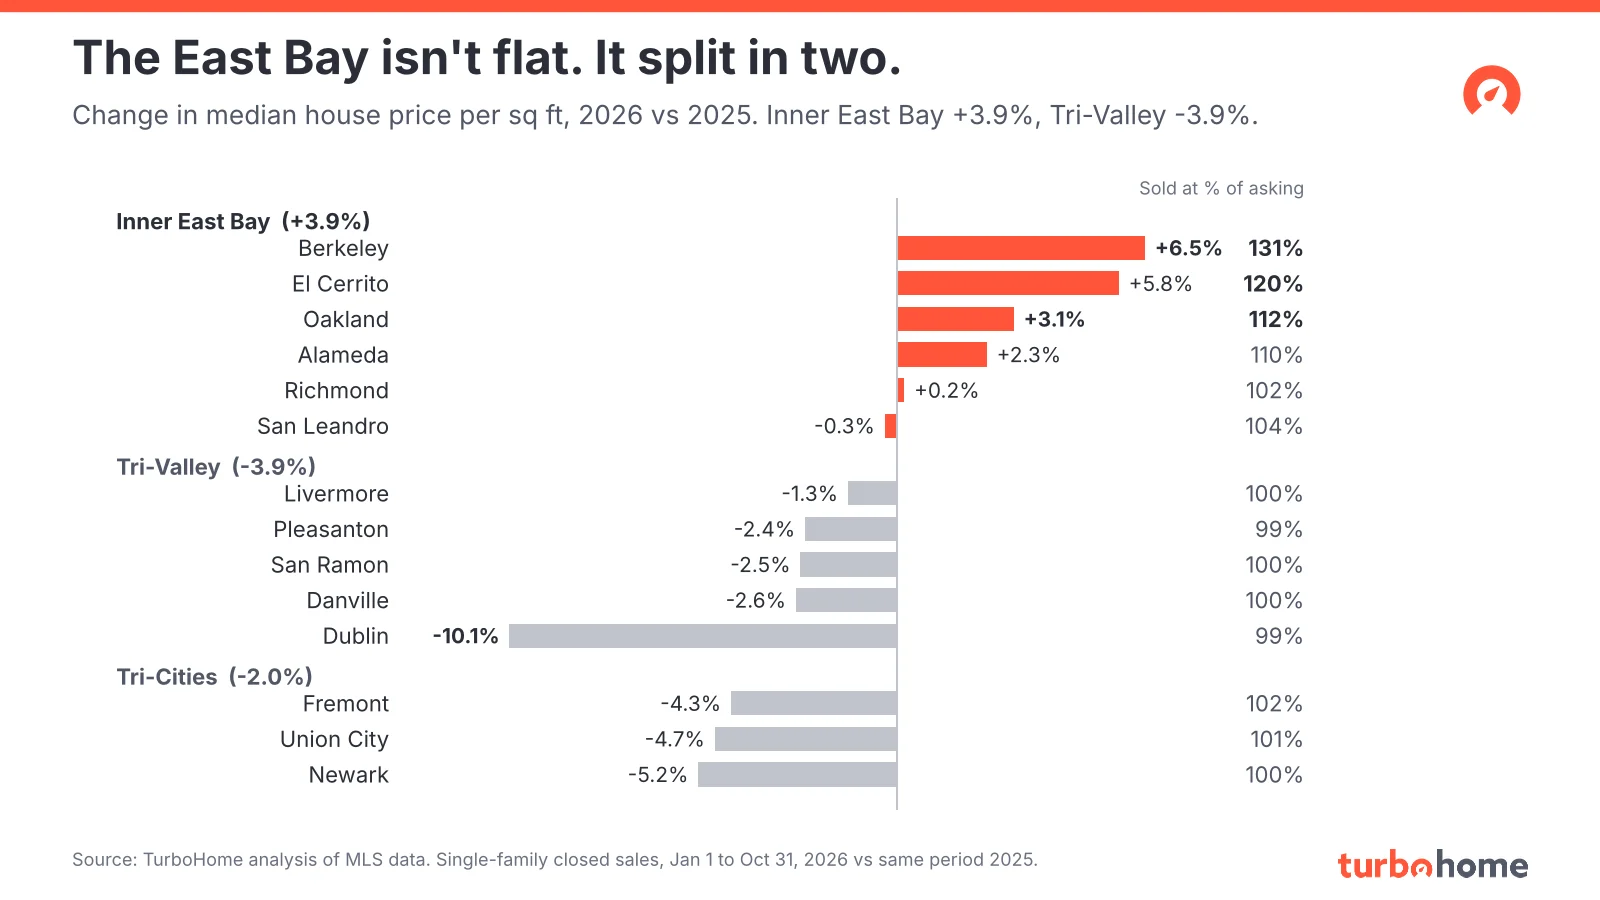
Every SF-facing city with enough sales held or gained value per foot. Every Tri-Valley and Tri-Cities city lost it. Sale-to-list follows the same line.
The two ends of the chart tell the story. Berkeley’s median house price per square foot rose 6.5%, and the median Berkeley house closed at 130.6% of list. Dublin’s fell 10.1%, and the median Dublin house closed at 99.0% of list, slightly under asking.
| City | Sales 2025 | Sales 2026 | $/sq ft 2025 | $/sq ft 2026 | YoY | Sale-to-list |
|---|---|---|---|---|---|---|
| Inner East Bay (pooled) | 3,323 | 3,244 | $649 | $674 | +3.9% | 111.3% |
| Berkeley | 444 | 477 | $913 | $972 | +6.5% | 130.6% |
| El Cerrito | 137 | 134 | $761 | $805 | +5.8% | 120.2% |
| Oakland | 1,565 | 1,536 | $590 | $608 | +3.1% | 111.6% |
| Alameda | 258 | 224 | $809 | $828 | +2.3% | 109.6% |
| Richmond | 442 | 399 | $497 | $498 | +0.2% | 102.4% |
| San Leandro | 318 | 286 | $630 | $628 | −0.3% | 104.0% |
| Tri-Valley (pooled) | 1,942 | 1,760 | $773 | $743 | −3.9% | 100.0% |
| Livermore | 560 | 503 | $706 | $697 | −1.3% | 100.0% |
| Pleasanton | 414 | 302 | $837 | $817 | −2.4% | 99.3% |
| San Ramon | 337 | 306 | $757 | $738 | −2.5% | 100.0% |
| Danville | 382 | 406 | $799 | $778 | −2.6% | 99.9% |
| Dublin | 246 | 238 | $774 | $696 | −10.1% | 99.0% |
| Tri-Cities (pooled) | 956 | 914 | $985 | $965 | −2.0% | 101.6% |
| Fremont | 597 | 585 | $1,089 | $1,042 | −4.3% | 102.1% |
| Union City | 186 | 153 | $823 | $784 | −4.7% | 101.4% |
| Newark | 173 | 176 | $871 | $826 | −5.2% | 100.0% |
Median single-family close price per living square foot, January to October of each year. Pooled rows cover the whole corridor; Inner East Bay pooled figures also include Piedmont, Albany and Emeryville. Sale-to-list is the 2026 median. YoY is computed from the rounded medians shown.
Where the bidding wars went
Bidding wars now live on one side of the hills.
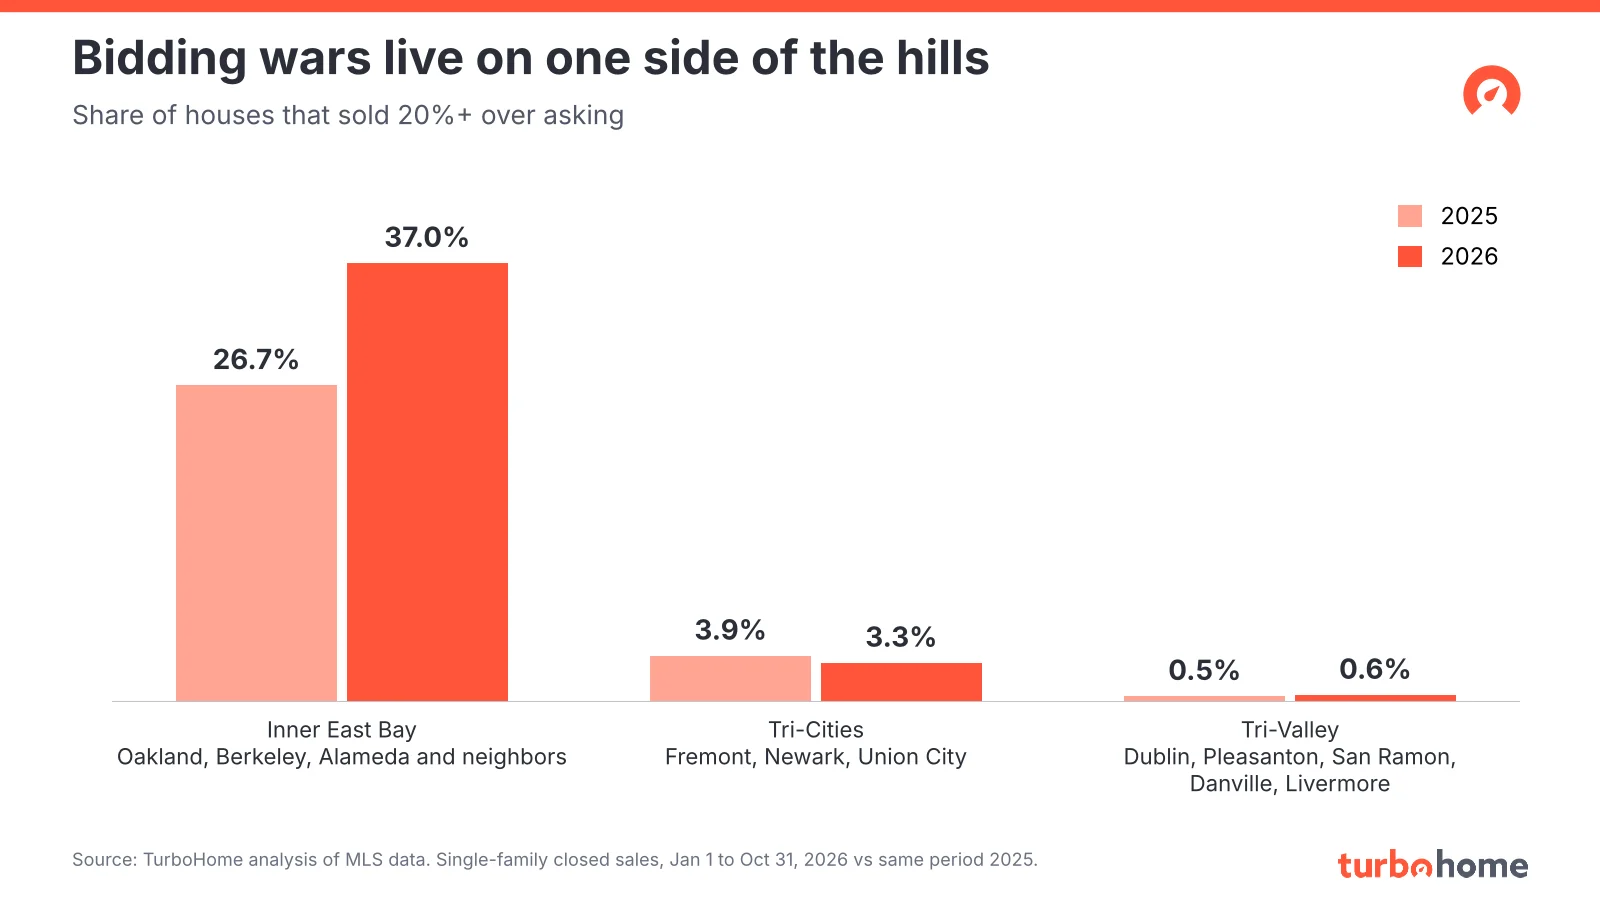
- 37% of inner East Bay houses closed at 20% or more over asking in 2026, up from 27% in 2025.
- In the Tri-Cities, it was 3.3%, down from 3.9%. In the Tri-Valley, 0.6%, about the same as last year’s 0.5%.
- The median Tri-Valley house closed at exactly 100% of list price in both years.
Price cuts went the other way
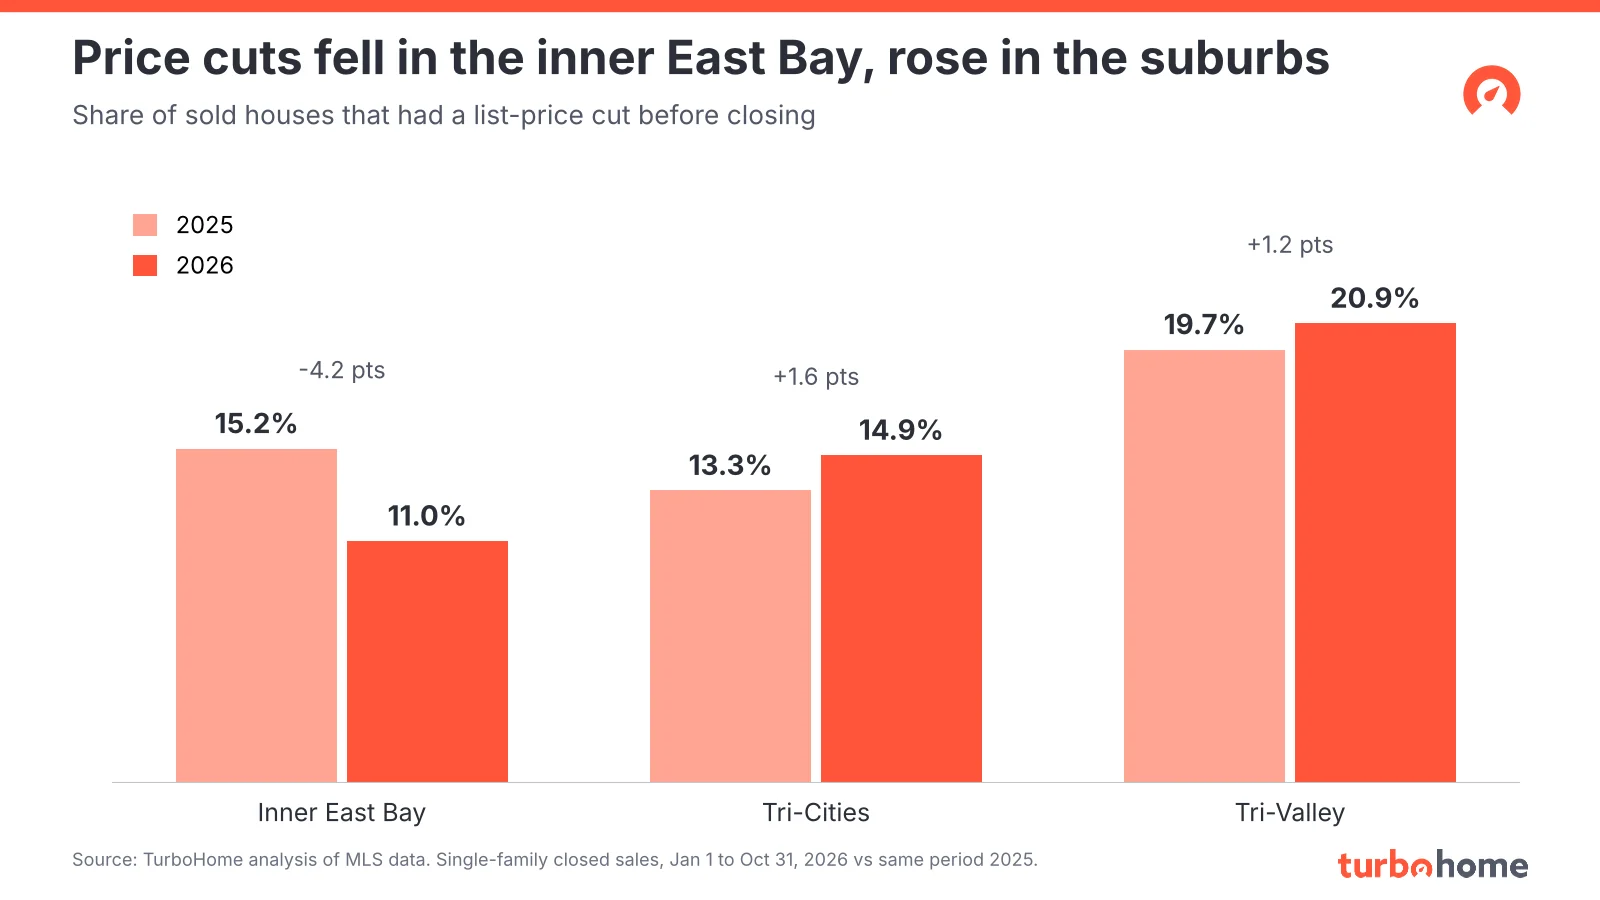
In the inner East Bay, 11.0% of sold houses had a list price cut, down from 15.2%. In the Tri-Cities, the share rose to 14.9%, from 13.3%. In the Tri-Valley, it rose to 20.9%, from 19.7%. About one in five Tri-Valley sellers had to come down before they found a buyer.
Why: follow the commute
Our data shows where prices moved, not why. One explanation fits the pattern well: the split follows the commute.
San Francisco is in the middle of a wealth-driven surge. Compass reported that San Francisco home prices were up 22.2% from 2025 and that 144 city homes sold for at least $1 million over asking in the first half of the year, according to The San Francisco Standard. Agents tie much of that demand to AI wealth and expected IPOs. The cities that gained the most in our data, Berkeley, El Cerrito, Oakland and Alameda, are the ones with the most direct access to San Francisco jobs.
The South Bay is moving the other way. The same Compass figures had Santa Clara County prices down almost 5%, and Redfin reported the San Jose metro median down 2% year over year in August while San Francisco’s rose 7.5%. The Tri-Valley along 580 and 680 and the Tri-Cities along 880 are where many South Bay commuters live, and they softened along with it.
The fit is not perfect. Richmond and San Leandro are on BART and were essentially flat. Treat the commute story as a hypothesis that matches the data, not a proven cause.
The Oakland comeback
Early in 2026, the headlines had Oakland in decline. Redfin’s February report listed the Oakland metro with the largest annual price drop of any major metro, at 5.6%.
For Oakland houses, the year turned out differently:
- The median Oakland house sold for $608 per square foot in 2026, up 3.1% from $590.
- The median sale closed at 111.6% of list, up from 106.3%.
- In the third quarter, the median Oakland house closed at 111.9% of list, and price cuts fell to 13.2% of sales, down from 19.2%.
Conventional wisdom said Oakland was the weak spot and the Tri-Valley was the safe bet. In 2026, the opposite held on price momentum.
The Tri-Valley premium was cut in half
In 2025, a Tri-Valley square foot cost 19% more than an inner East Bay square foot. In 2026, it costs 10% more.
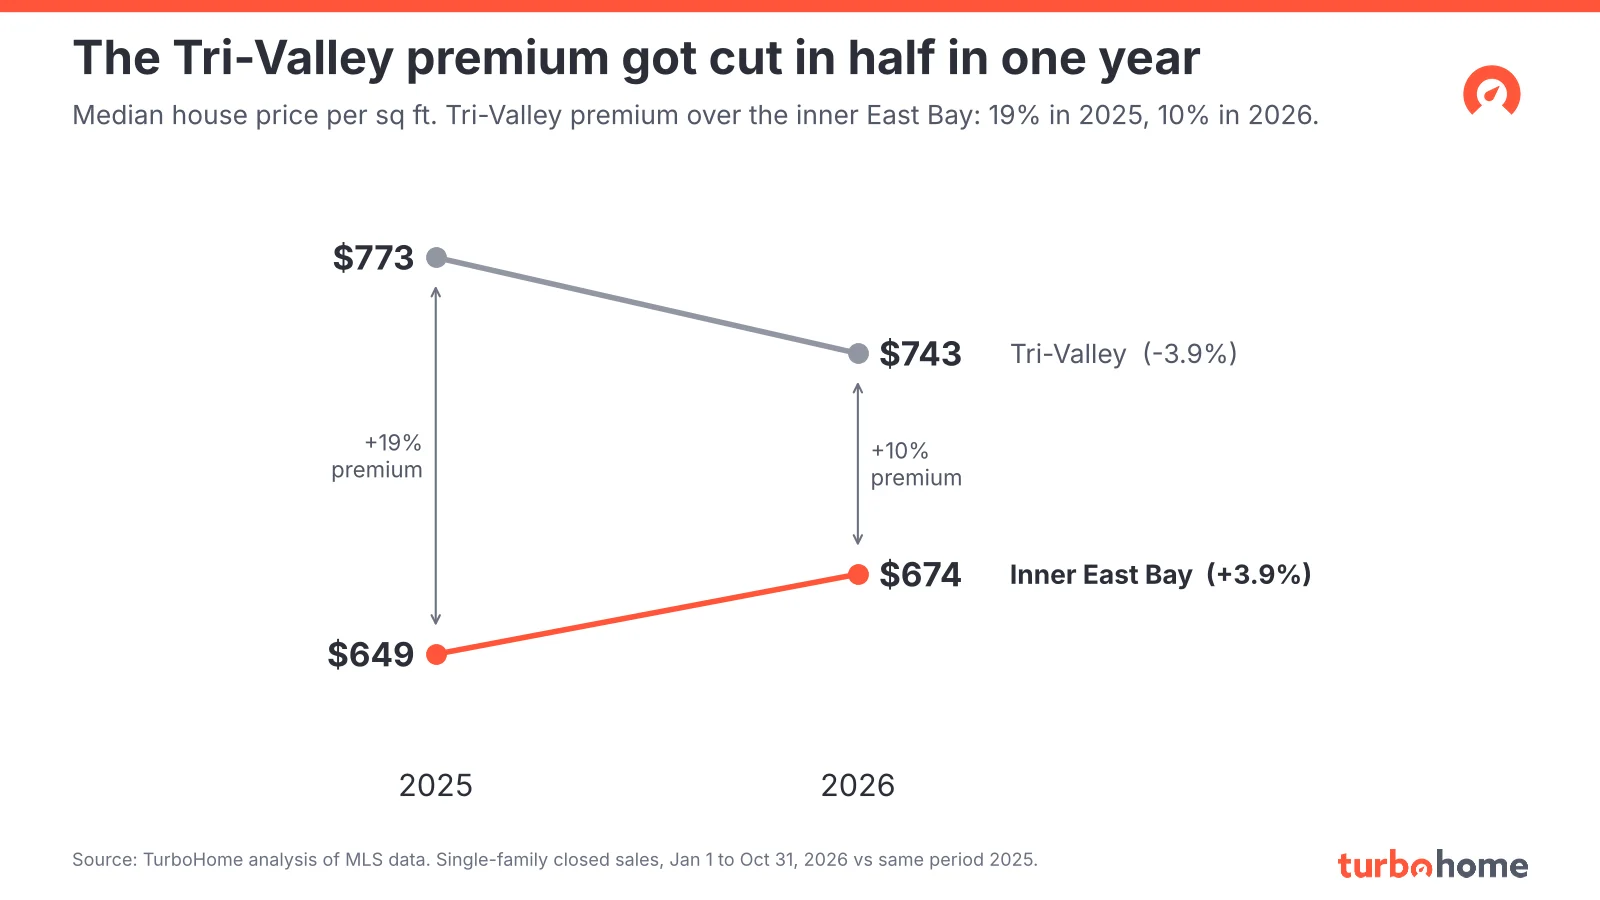
Here is what that means at the median price per foot. In 2025, a 2,000-square-foot house cost about $1.30 million in the inner East Bay and $1.55 million in the Tri-Valley, a gap of about $250,000. In 2026, the same comparison is $1.35 million and $1.49 million, a gap of about $140,000.
For move-up buyers, trading inner East Bay equity for a bigger Tri-Valley home buys meaningfully more house per dollar than it did a year ago. For Tri-Valley owners planning to move toward San Francisco, the math has moved against them.
What this means if you’re buying or selling in the East Bay
Buyers in the Tri-Valley and Tri-Cities: negotiate
The median house in the Tri-Valley sells at list, and one in five sales had a price cut. Check each listing’s price history and days on market before you write. There is room to ask for credits, repairs, or a lower price, especially on homes that have already been reduced. See the Pleasanton, San Ramon and Fremont housing market pages for local detail.
Buyers in Berkeley, Oakland and El Cerrito: list price is a starting bid
In these cities, list price is a marketing number. The median Berkeley house closed at 131% of list. Base your offer on what similar homes on nearby blocks actually sold for, not on the asking price. See the Berkeley, Oakland and Alameda housing market pages.
Sellers: price off 2026 comps, not 2025
Inner East Bay sellers are in conditions closer to San Francisco’s, with fewer price cuts and frequent overbids. Tri-Valley sellers who price off 2025 sales are pricing into a falling market, and the price-cut data shows what happens next. Use sales from the last few months.
Everyone: overbids inflate percentage commissions
Whichever side of the hills you’re on, the math of commissions matters. On a $1.7M Berkeley house closing at 130% of list, the overbid alone is about $400,000. A 2.5% commission on that overbid is about $10,000, and a percentage-based fee grows with every bid. TurboHome’s flat fee doesn’t.
For a closer look at the other side of the Bay, see our analysis of San Francisco condo vs. house prices.
Methodology notes
- Source: TurboHome analysis of MLS closed sales in Alameda and Contra Costa counties.
- Property type: Single-family residences only.
- Date range: Closings from January through October of 2025 and 2026. Year-over-year changes compare the same months in each year.
- Corridors: Inner East Bay is Oakland, Berkeley, Alameda, El Cerrito, Richmond, San Leandro, Piedmont, Albany and Emeryville. Tri-Valley is Dublin, Pleasanton, San Ramon, Danville and Livermore. Tri-Cities is Fremont, Newark and Union City. Piedmont, Albany and Emeryville are included in the inner East Bay pooled figures but not shown as separate cities.
- Metrics: Medians throughout. Price per square foot is close price divided by MLS living area. Year-over-year changes are computed from the rounded medians shown.
- Sample sizes: 2026 had 3,244 inner East Bay, 1,760 Tri-Valley and 914 Tri-Cities sales. 2025 had 3,323, 1,942 and 956. City samples range from 134 to 1,565 sales per year.
- Caveats: City medians can shift with the mix of homes and neighborhoods that sold. Off-MLS sales are excluded.
- MLS attribution: Data in this report is derived from MLS closed-sale records and is provided for informational purposes only. It has not been independently verified by the Multiple Listing Service and may differ from figures published by MLS associations due to differing cutoff dates, cleaning rules, or geographic groupings.
Sources & further reading
- September 2026 home sales and price report (California Association of Realtors, October 19, 2026): Alameda and Contra Costa county medians.
- San Francisco real estate enters its bidmaxxing era (The San Francisco Standard, July 7, 2026): Compass figures on San Francisco and Santa Clara County prices and $1 million overbids.
- Housing supply hits 6-year high as new listings jump (Redfin, September 9, 2026): San Jose and San Francisco metro prices for August.
- February 2026 market tracker (Redfin, March 19, 2026): Oakland metro price change.
These third-party sources use their own methods and reporting windows and may not match TurboHome’s figures exactly. They are included as context, not as the underlying data for this report.
Frequently asked questions
Are East Bay home prices going up or down in 2026?
Both, depending on the side of the hills. In TurboHome’s analysis of single-family closed sales from January through October 2026, the median price per square foot rose 3.9% in the inner East Bay (Oakland, Berkeley, Alameda and neighbors), fell 3.9% in the Tri-Valley (Dublin, Pleasanton, San Ramon, Danville, Livermore) and fell 2.0% in the Tri-Cities (Fremont, Newark, Union City), compared with the same months of 2025.
Are Oakland home prices falling in 2026?
Not for houses on a price-per-square-foot basis. The median Oakland single-family home sold for $608 per square foot from January through October 2026, up 3.1% from $590 a year earlier, and closed at a median 111.6% of list price, up from 106.3%.
How much over asking do Berkeley houses sell for?
The median Berkeley single-family home closed at 130.6% of list price from January through October 2026. Across the inner East Bay, 37% of houses closed at 20% or more over asking, up from 27% in the same months of 2025.
Is it a good time to buy in the Tri-Valley?
Buyers have more leverage in the Tri-Valley than in the inner East Bay right now. The median Tri-Valley house closed at exactly 100% of list price in 2026, only 0.6% closed 20% or more over asking, and 20.9% of sales had a list price cut. The Tri-Valley’s price-per-square-foot premium over the inner East Bay fell from 19% in 2025 to 10% in 2026.
Talk to a TurboHome agent about your side of the hills
Overbid strategy wins in the inner East Bay. Pricing discipline and negotiation win in the Tri-Valley and Tri-Cities. Talk to a TurboHome agent about pricing or bidding strategy for your city.
About the Author
Lucas Beard
Lucas Beard is COO of TurboHome and holds California DRE license 02417843. His guides reflect TurboHome's buyer-side experience and link to primary sources for regulatory, lender, market, and competitor claims.
View Lucas on LinkedInAbout Kevin Kretzmer
Head Agent, California
Kevin Kretzmer leads TurboHome's California agent team and reviews California and national buyer guidance for practical brokerage accuracy.
View Kevin's profile