Bay Area Market Analysis
Summer, Not the Holidays, Is the Bay Area's Price-Cut Season

Reviewed by:

Head Agent, California · CalDRE #01997822
Every November, Bay Area sellers hear the same advice: don’t list over the holidays, wait for spring. Our data says the holidays are not where sellers get hurt. Summer is. Across 123,226 Bay Area listings from 2023 to 2025, 24.6% of homes listed from June to September cut their asking price, compared with 17.2% of homes listed in November and December.
TurboHome Market Analysis · Bay Area · Published November 5, 2026
The takeaway up front: if you are ready to sell now, a holiday listing is not a penalty box. Holiday sellers faced far fewer competing listings and cut their price least often. The catch is that fewer of them sold, so the price has to be right on day one.
The worry is understandable this year. Nationally, 22% of home sellers with active listings cut their asking price in the four weeks ending October 11, 2026, up from 20.9% a year earlier and the highest share in Redfin’s records, according to Redfin. Headlines like that make a December listing feel like a bad bet.
So we asked a narrower question: when in the year do Bay Area sellers actually cut? We looked at every single-family, condo and townhouse listing in San Francisco, Alameda, Contra Costa, San Mateo and Santa Clara counties that came on the market from January 2023 to December 2025, and grouped them by the month they were listed.
The best time to sell a house in the Bay Area, measured by price cuts
A price cut is a mispricing signal. It means the first asking price was higher than buyers would pay. By that measure, Bay Area sellers misprice most in summer and least over the holidays.
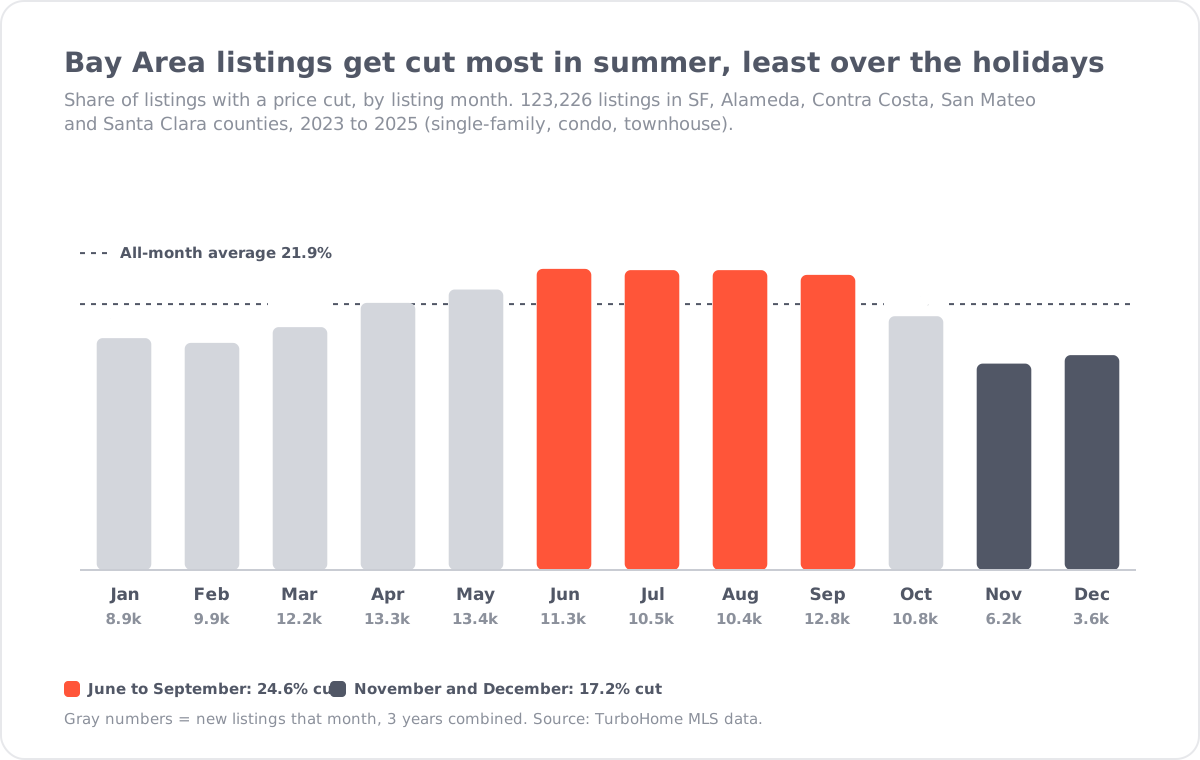
- Cuts climb through spring. 18.7% of February listings had a price cut, rising to 22.0% in April and 23.1% in May.
- Summer is the peak. Listings from June to September were cut 24.3% to 24.8% of the time, about 1 in 4.
- The holidays are the low. The rate falls to 20.9% for October listings and 17.0% for November listings, the lowest of the year. December sits at 17.7%.
Even spring cuts more than the holidays. Listings from February to April were cut 20.4% of the time, above the 17.2% for November and December.
This isn’t a fluke
The summer gap showed up in every year we studied, and it widened as the market cooled.
| Listing year | Listed June to Sept, share cut | Listed Nov and Dec, share cut | Gap |
|---|---|---|---|
| 2023 | 18.7% | 14.2% | 4.5 pts |
| 2024 | 24.8% | 18.4% | 6.4 pts |
| 2025 | 28.4% | 18.3% | 10.1 pts |
Notice what happened in 2025. Summer cuts kept rising, to 28.4%, while the holiday rate held flat at about 18%.
It also showed up in every county. For this cut, we looked only at homes that sold and compared homes listed from July to September with homes listed in November and December.
| County | Listed July to Sept, share cut | Listed Nov and Dec, share cut |
|---|---|---|
| San Francisco | 20.7% | 11.5% |
| San Mateo | 19.4% | 11.2% |
| Santa Clara | 18.4% | 10.9% |
| Alameda | 19.4% | 13.1% |
| Contra Costa | 25.2% | 18.3% |
In San Francisco, San Mateo and Santa Clara counties, sold homes listed in summer were cut about 1.7 to 1.8 times as often as those listed over the holidays.
Why summer is the price-cut season
The short answer is volume. Across the three years, each summer month brought 10,370 to 12,753 new listings. November brought 6,223. December brought 3,595, just 27% of May’s 13,436, the busiest month of the year.
Our read: summer sellers list into a crowded market just as the spring rush of buyers thins out. Many set their price off the spring sales they saw in April and May. When those comps don’t hold in July, the price comes down.
Holiday sellers face the opposite setup. A December seller competes with about a quarter as many new listings as a May seller, and the data shows they rarely had to cut.
The catch: fewer holiday listings sell
The holiday window isn’t free. Two numbers point the other way.
- Sell-through. 79.5% of homes listed in November and December sold, compared with 85.7% of homes listed from February to April. About 1 in 5 holiday listings did not sell.
- Price. Homes listed from February to April closed at 101.0 to 101.1 on location-adjusted price per square foot, where 100 is the local going rate. Holiday listings closed at 98.8 to 99.5. That’s about 2 points, or roughly $30,000 on a $1.5 million home.
Put those together and the holiday window rewards one thing: a price that is right on day one. A well-priced December listing tends to hold its price. An overpriced one has fewer buyers around to bail it out, and a better chance of coming off the market unsold.
A word on cause and effect. Holiday sellers are a self-selected group, and many are likely motivated and well advised. The data shows what happened to the people who chose to list in November and December. It doesn’t prove that any seller who moved their listing date would get the same result.
A playbook by situation
If you’re ready to sell now
List. Waiting for spring means joining a much bigger crowd, and spring listings were cut more often than holiday listings. Price at market from recent comparable sales, not at a number you hope spring buyers will pay, because 1 in 5 holiday listings did not sell. How you write the number matters too: see our analysis of teaser list prices like $1,495,000.
If you missed spring
Don’t default to July. Listings from June to September were cut 24.3% to 24.8% of the time, the highest of the year. If you can still list by May, do it. Otherwise, consider October through December, when cut rates fall to 17.0% to 20.9%.
If you’re buying
Summer listings are where negotiating room shows up, with about 1 in 4 cutting their price. Holiday listings are fewer, priced tighter and less likely to drop, so don’t assume a December seller is desperate. For timing your offer on any listing, see our analysis of the 15-day price cliff.
If you’re investing
The lowest prices against the local benchmark showed up for homes listed from August to November, at 98.8 to 99.3 on our location-adjusted price per square foot index. December was not the cheapest month.
Methodology notes
- Source: TurboHome analysis of MLS listing records.
- Geography: San Francisco, Alameda, Contra Costa, San Mateo and Santa Clara counties. North Bay counties are excluded because Marin County has too few records in our tables.
- Property types: Single-family homes, condominiums and townhouses.
- Date range: Homes listed from January 1, 2023 to December 31, 2025, grouped by listing month.
- Sample size: 123,226 listings.
- Metrics: “Share cut” is the share of listings that had at least one reduction to the asking price. “Sold” is the share of listings that went on to sell. County figures cover sold homes only and compare July to September listings with November and December listings. The location-adjusted price per square foot index compares each sale’s price per square foot with the local benchmark, where 100 is the going rate.
- Caveats: Monthly listing counts are three years combined. The location adjustment controls for where a home is, not for condition, layout or views. Sellers choose when to list, so differences between months reflect who lists as well as when.
- MLS attribution: Data in this report is derived from MLS listing records and is provided for informational purposes only. It has not been independently verified by the Multiple Listing Service and may differ from figures published by MLS associations due to differing cutoff dates, cleaning rules, or geographic groupings.
The data by listing month
Listings by month listed, 2023 to 2025 combined.
| List month | New listings | Share with a price cut | Share sold |
|---|---|---|---|
| January | 8,859 | 19.1% | 90.4% |
| February | 9,895 | 18.7% | 88.0% |
| March | 12,184 | 20.0% | 85.1% |
| April | 13,324 | 22.0% | 84.4% |
| May | 13,436 | 23.1% | 84.4% |
| June | 11,276 | 24.8% | 84.5% |
| July | 10,532 | 24.7% | 83.2% |
| August | 10,370 | 24.7% | 83.6% |
| September | 12,753 | 24.3% | 82.3% |
| October | 10,779 | 20.9% | 80.1% |
| November | 6,223 | 17.0% | 79.3% |
| December | 3,595 | 17.7% | 79.8% |
Sources
- TurboHome analysis of MLS listing records, January 2023 to December 2025.
- Redfin, “Redfin Reports List Prices Fall for the First Time Since March,” October 15, 2026.
Frequently asked questions
What is the best time to sell a house in the Bay Area?
It depends on what you want to avoid. In TurboHome’s analysis of 123,226 listings in San Francisco, Alameda, Contra Costa, San Mateo and Santa Clara counties from 2023 to 2025, homes listed in November and December had a price cut 17.2% of the time, the lowest of the year, and homes listed from June to September had one 24.6% of the time, the highest. Homes listed from February to April sold more often (85.7%) than holiday listings (79.5%) and closed about 2 points higher on location-adjusted price per square foot. If you are ready now, list now and price at market. If you can wait, list by May or in the fall rather than in mid-summer.
Should I wait until spring to sell my Bay Area home?
Not by default. Bay Area listings from February to April were cut 20.4% of the time, more often than listings from November and December (17.2%), and spring brings far more competition: 13,436 new listings in May across 2023 to 2025, against 3,595 in December. Spring did offer a higher sell-through rate (85.7% vs 79.5%) and about 2 points more on location-adjusted price per square foot, so waiting can make sense if your home is not ready to show now.
Is it bad to list a house in December in the Bay Area?
No. From 2023 to 2025, 17.7% of Bay Area homes listed in December had a price cut, below the all-month average of 21.9%, and December had about a quarter of May’s new listings. The risk is sell-through: 79.8% of December listings sold, compared with 85.7% of February to April listings. A December listing works best when it is priced at market on day one.
Do Bay Area home sellers cut prices more in summer?
Yes. Every year from 2023 to 2025, homes listed from June to September were cut more often than homes listed in November and December: 18.7% vs 14.2% in 2023, 24.8% vs 18.4% in 2024 and 28.4% vs 18.3% in 2025. The pattern held in all five counties TurboHome studied, including San Francisco, where 20.7% of sold homes listed from July to September had a price cut, against 11.5% of those listed in November and December.
Keep more of the sale, whenever you list
Timing is one lever; commission is another. TurboHome lists your home for a flat fee with full-service agents and MLS data like this behind every pricing call, so whether you list in December or May, you keep more of the sale. See how Bay Area realtor fees work to compare the cost.
About the Author
Lucas Beard
Lucas Beard is COO of TurboHome and holds California DRE license 02417843. His guides reflect TurboHome's buyer-side experience and link to primary sources for regulatory, lender, market, and competitor claims.
View Lucas on LinkedInAbout Kevin Kretzmer
Head Agent, California
Kevin Kretzmer leads TurboHome's California agent team and reviews California and national buyer guidance for practical brokerage accuracy.
View Kevin's profile