LA County Market Analysis
LA County Housing Market by Neighborhood: SFH vs. Condo, June 2026

Reviewed by:

Head Agent, California · CalDRE #01997822
TurboHome Market Analysis · Los Angeles County · Published July 2026
The takeaway up front: zone averages routinely hide 5–10 percentage point swings between neighborhoods sitting a few miles apart, and in several cases, SFH and condo in the same city are moving in opposite directions.
The big picture: zone-level stats
| Zone | Property type | Closed | Avg. vs. final list | Avg. days on market |
|---|---|---|---|---|
| Westside | SFH | 289 | −1.1% | 39 days |
| Westside | Condo | 228 | −2.0% | 45 days |
| South Bay | SFH | 260 | +0.6% | 26 days |
| South Bay | Condo | 102 | −0.7% | 35 days |
| San Fernando Valley | SFH | 593 | −0.1% | 32 days |
| San Fernando Valley | Condo | 163 | −1.0% | 42 days |
| San Gabriel Valley / Pasadena | SFH | 557 | +1.7% | 30 days |
| San Gabriel Valley / Pasadena | Condo | 177 | −0.3% | 45 days |
| Central LA | SFH | 250 | +2.4% | 38 days |
| Central LA | Condo | 75 | −2.1% | 56 days |
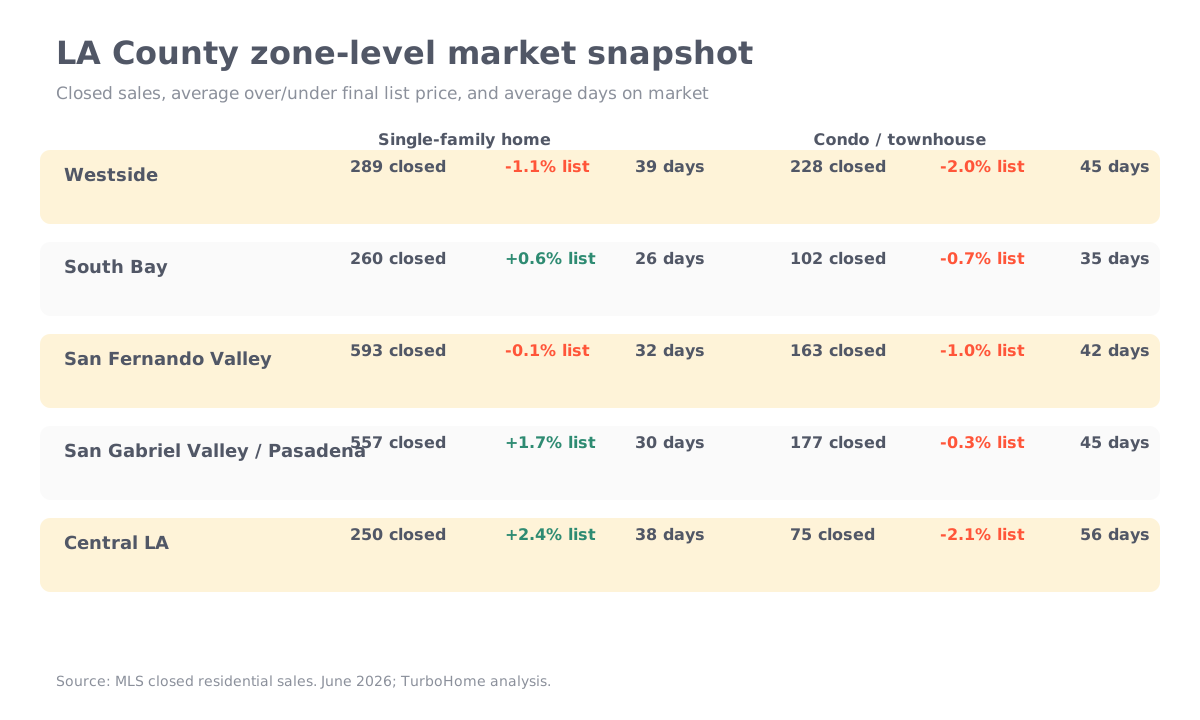
The pattern holds across every zone: single-family homes close closer to (or above) asking price and move faster than condos in the same market. Condo/TH sits slowest in Central LA, averaging 56 days on market, nearly three weeks longer than that zone’s SFH stock. South Bay is the tightest overall market on both metrics, with SFH averaging just 26 days to close.
That’s the 30,000-foot view. It’s also the version of this data that’s easiest to draw the wrong conclusions from, because it averages away the exact spread that matters if you’re pricing a listing or timing an offer in a specific neighborhood.
Price-to-list by neighborhood
Zone averages compress a wide range of outcomes into one number. Below is the same June 2026 data, broken out by the top 10 cities/neighborhoods by closing volume in each zone (minimum 8 closed sales per property type to appear).
Westside
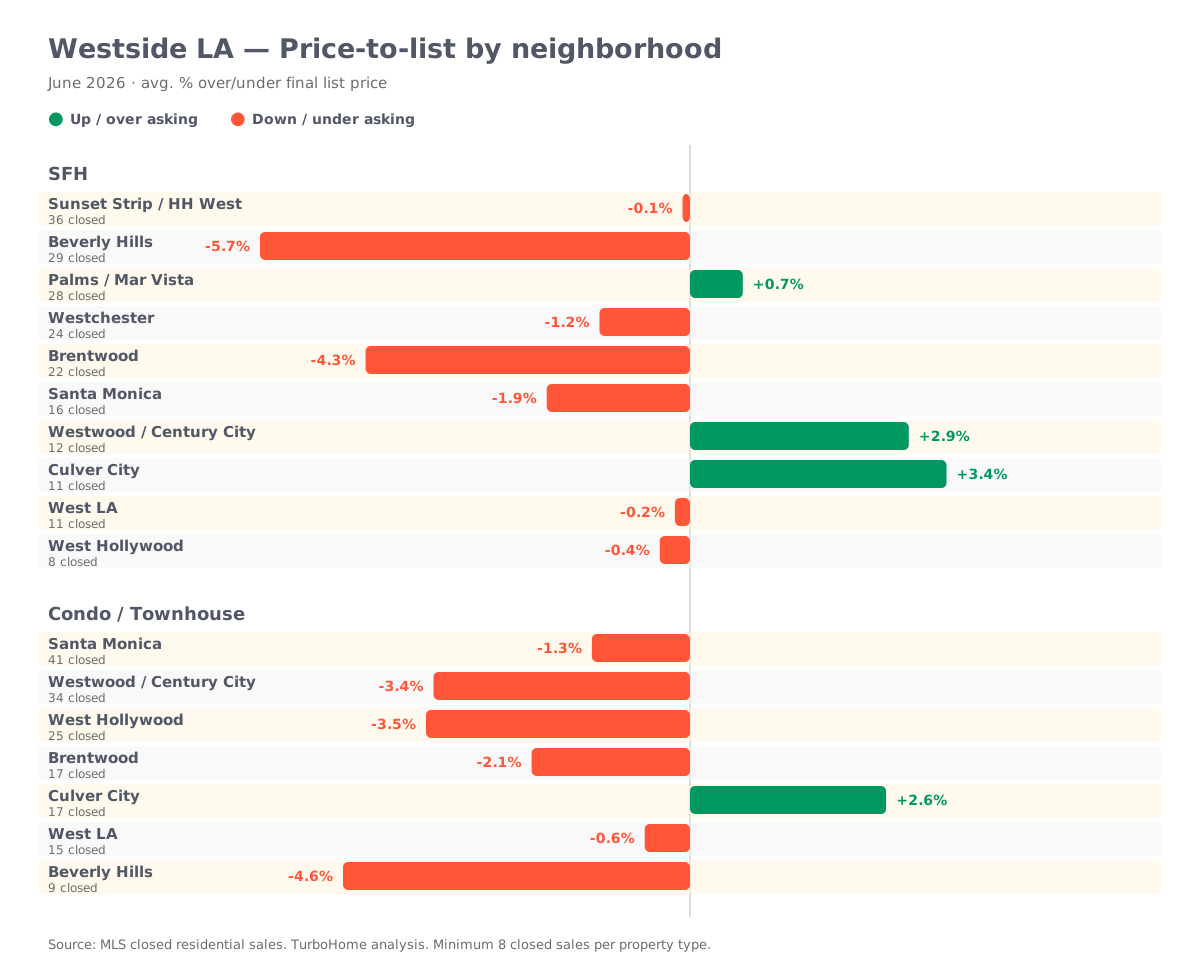
Westside is the widest-spread zone in the data. Culver City SFH is running +3.4% over list while Beverly Hills SFH sits −5.7% under, a 9-point swing inside one zone. Beverly Hills condo is even softer at −4.6% under. West Hollywood condo trails at −3.5%, the weakest condo pocket on the Westside outside Beverly Hills.
South Bay
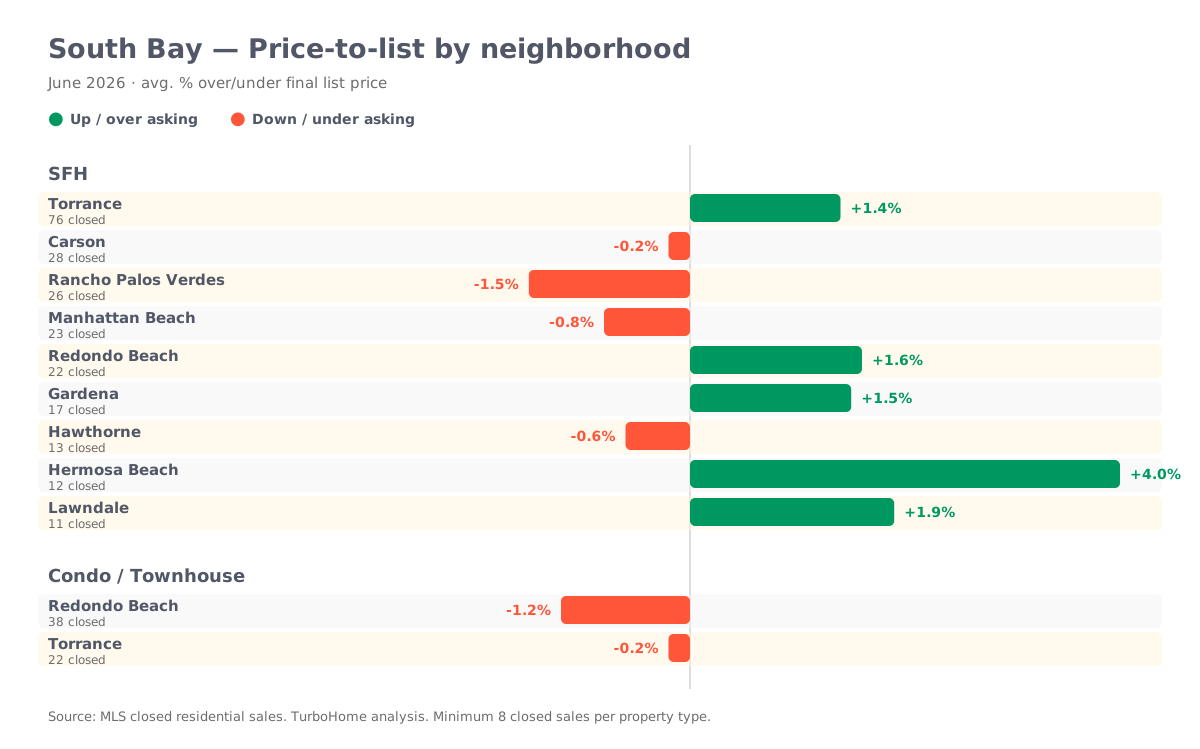
Hermosa Beach SFH leads the zone at +4.0% over list, the strongest single number in South Bay. But most of the zone’s cities (Torrance, Carson, Gardena, Hawthorne) cluster much closer to flat, which means the zone’s headline +0.6% is being pulled up by a handful of hot pockets rather than reflecting broad strength. Redondo Beach condo (−1.2%) and Gardena condo (−0.9%) are the softest condo numbers in the zone.
San Fernando Valley
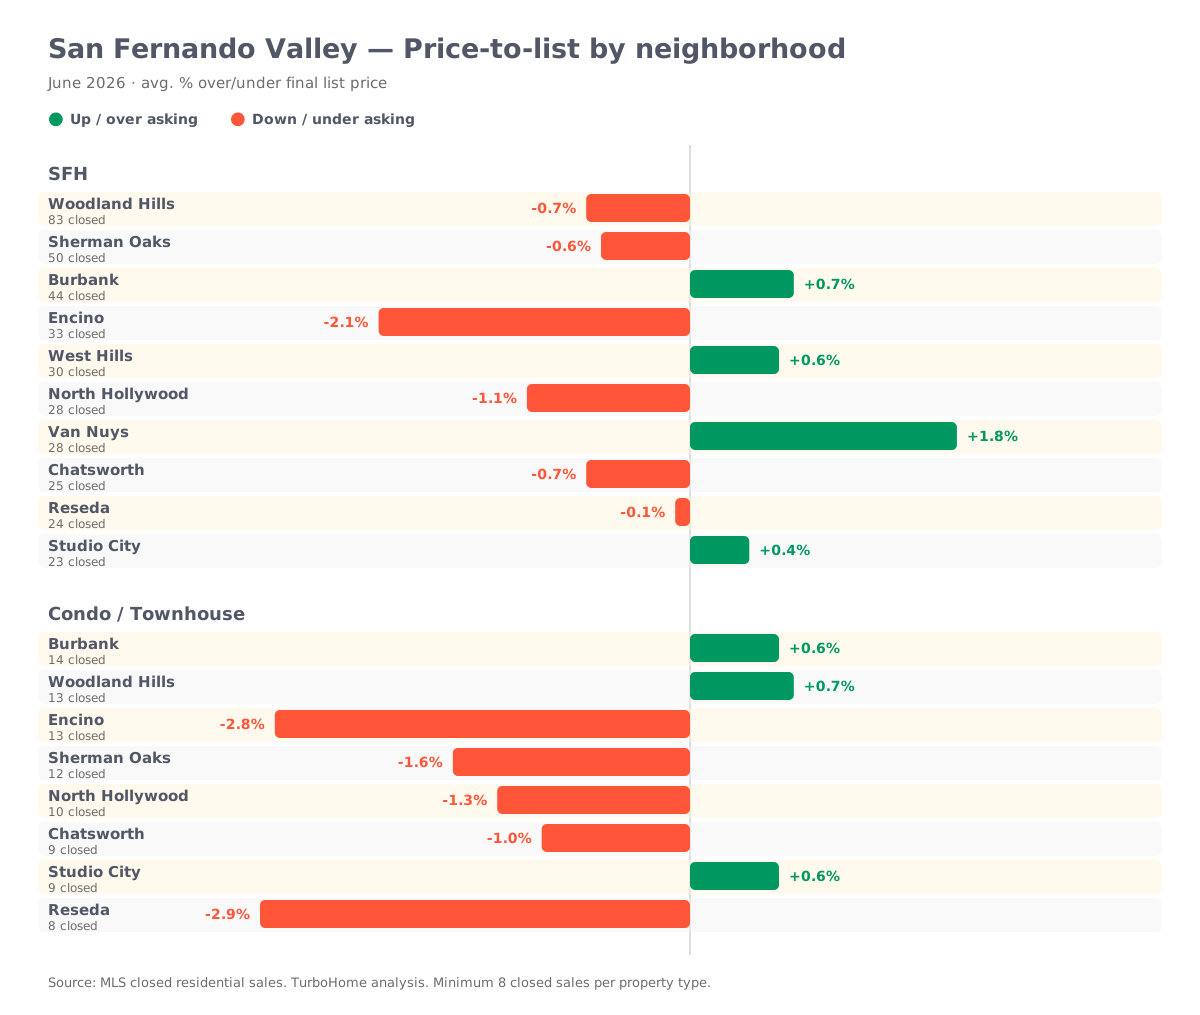
Van Nuys SFH (+1.8%) and Burbank SFH (+0.7%) are the Valley’s strongest performers. Reseda condo is the weak point at −2.9% under list, and Encino trails on both property types (SFH −2.1%, condo −2.8%), the only city in the zone underperforming across the board on both metrics.
San Gabriel Valley / Pasadena
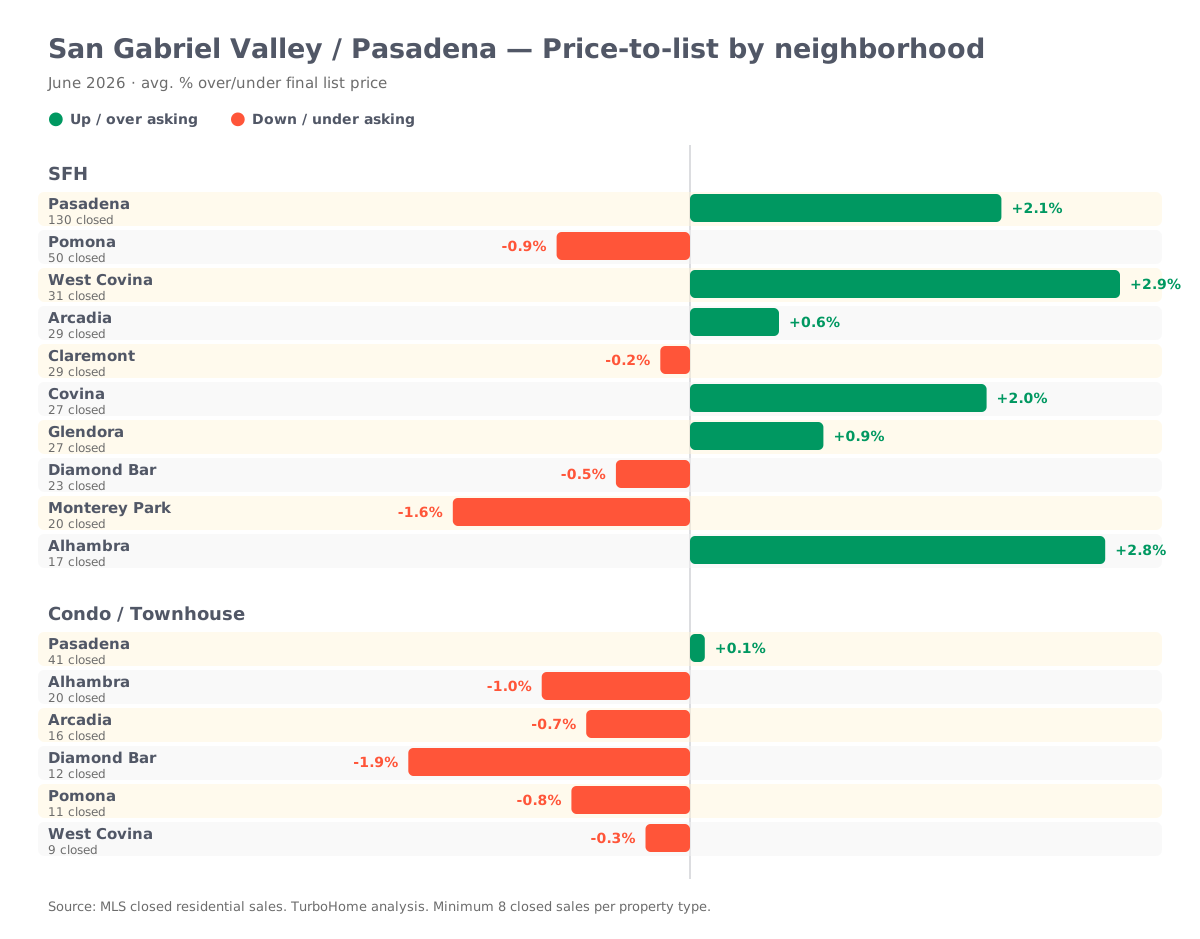
West Covina SFH (+2.9%) and Alhambra SFH (+2.8%) lead the zone, both meaningfully ahead of Pasadena’s own SFH number (+2.1%) despite Pasadena carrying by far the most volume (130 closed). Alhambra condo is the standout divergence: −1.0% under list, a 3.8-point gap from its own city’s SFH performance.
Central LA
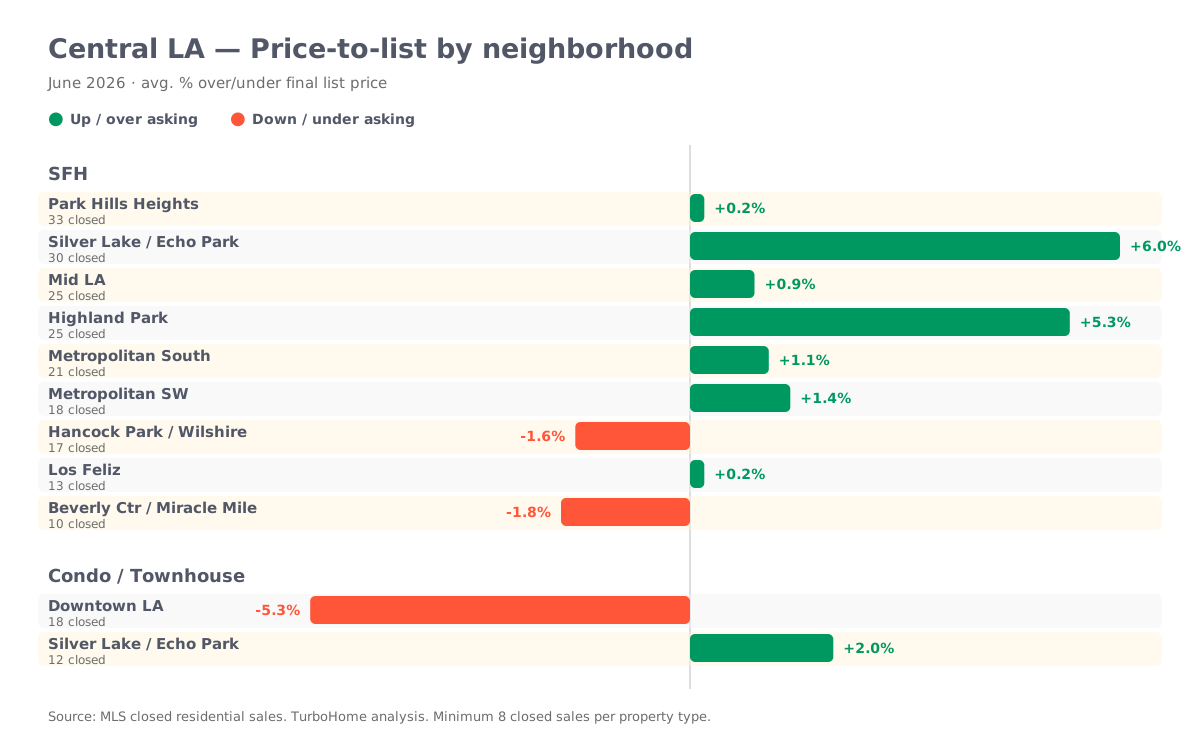
Silver Lake/Echo Park SFH is the single hottest number in the entire dataset at +6.0% over list, followed closely by Highland Park SFH at +5.3%. Downtown LA condo is the coldest, at −5.3% under list on 18 closed sales, more than 11 points below Silver Lake’s SFH number within the same zone.
What the price-to-list data shows across all five zones: SFH consistently outperforms condo on price-to-list, but the size of that gap varies enormously by neighborhood, from single digits in tight zones like South Bay to double-digit swings in Central LA and the Westside. Treating a zone-level average as representative of any one neighborhood inside it is the most common mistake we see in market read-throughs.
Days on market: speed buckets by neighborhood
Price tells you what buyers paid. Speed tells you how much competition they faced to get it. Below, the share of June 2026 closings in each city/neighborhood that took under 14 days, 14–30 days, or 30+ days to close.
Westside
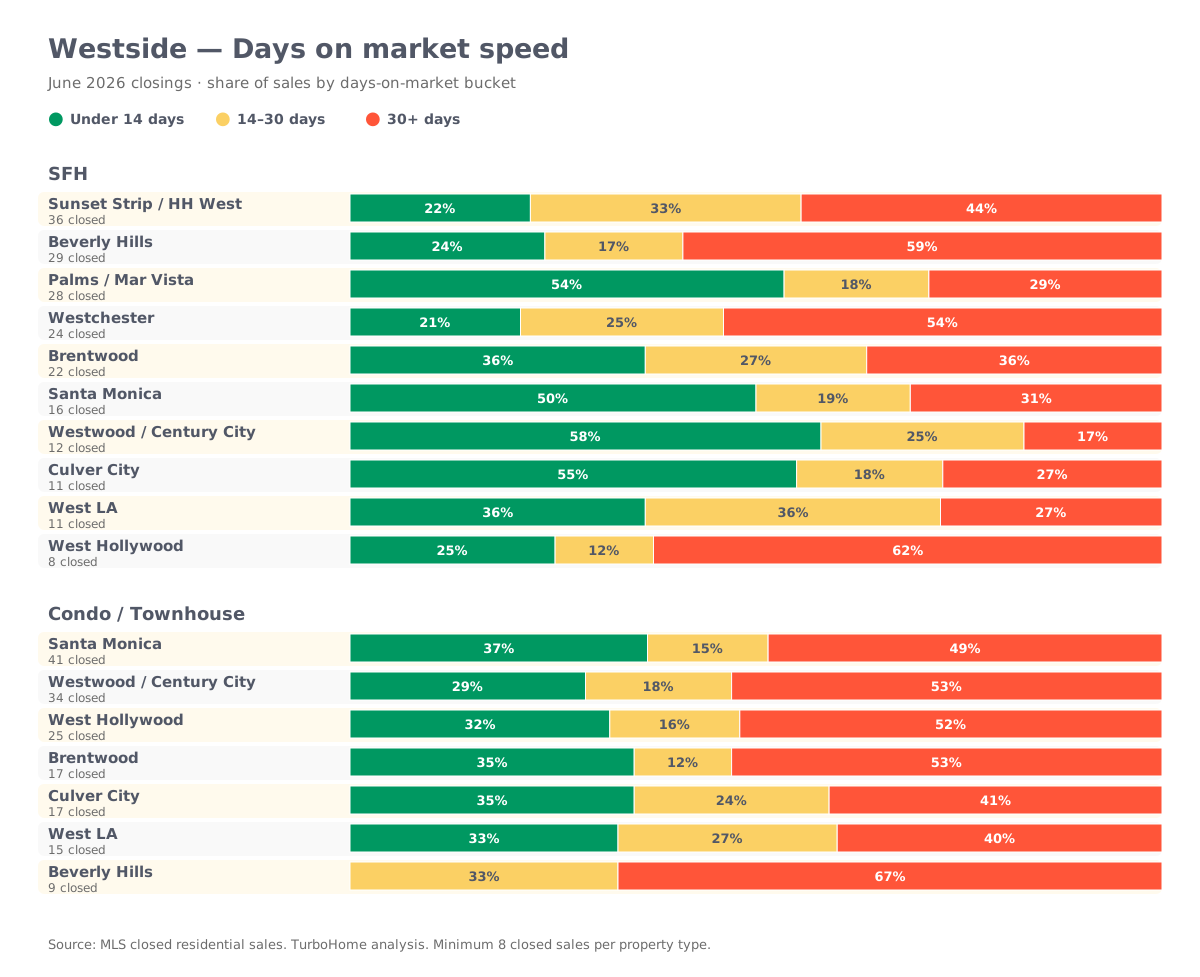
Culver City SFH is the fastest-moving pocket on the Westside (matching its strong price performance), while Beverly Hills SFH and West Hollywood condo both skew heavily toward 30+ days, consistent with their soft price-to-list numbers above.
South Bay
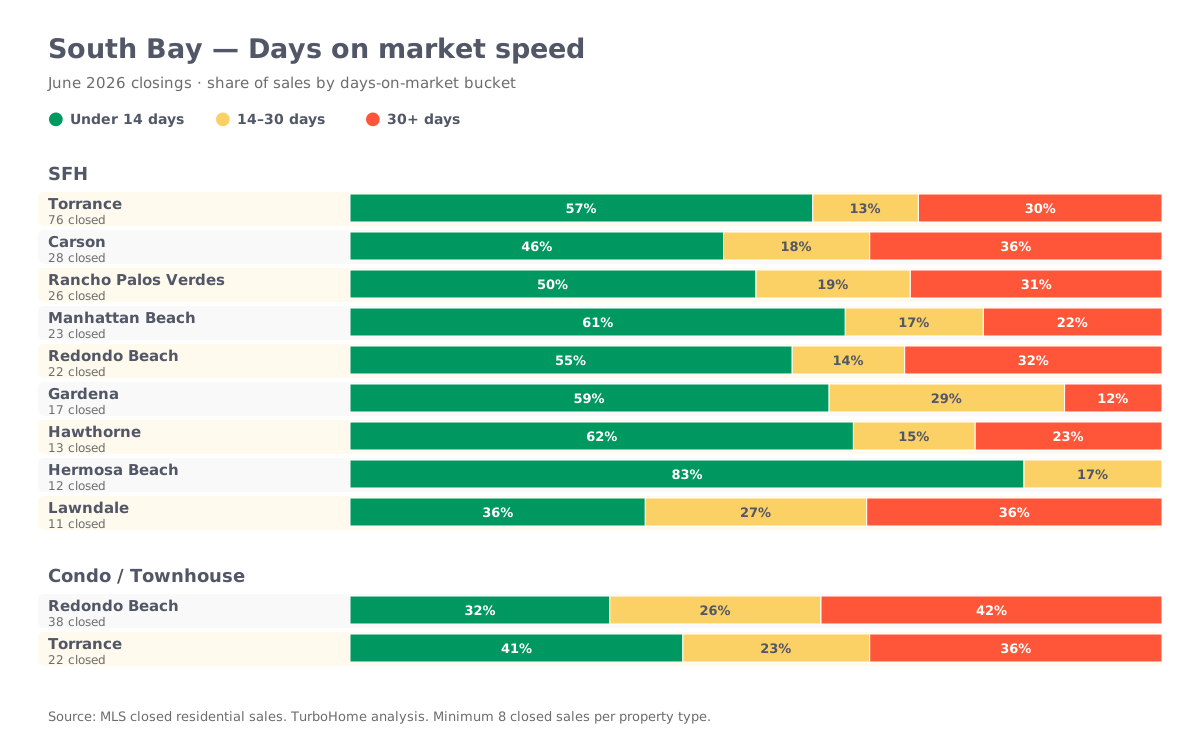
Hermosa Beach SFH is the fastest-moving pocket in the entire dataset: 83% of June closings there took under 14 days. Gardena SFH is close behind. This zone has the fewest 30+ day listings of any zone, consistent with its overall tight market.
San Fernando Valley
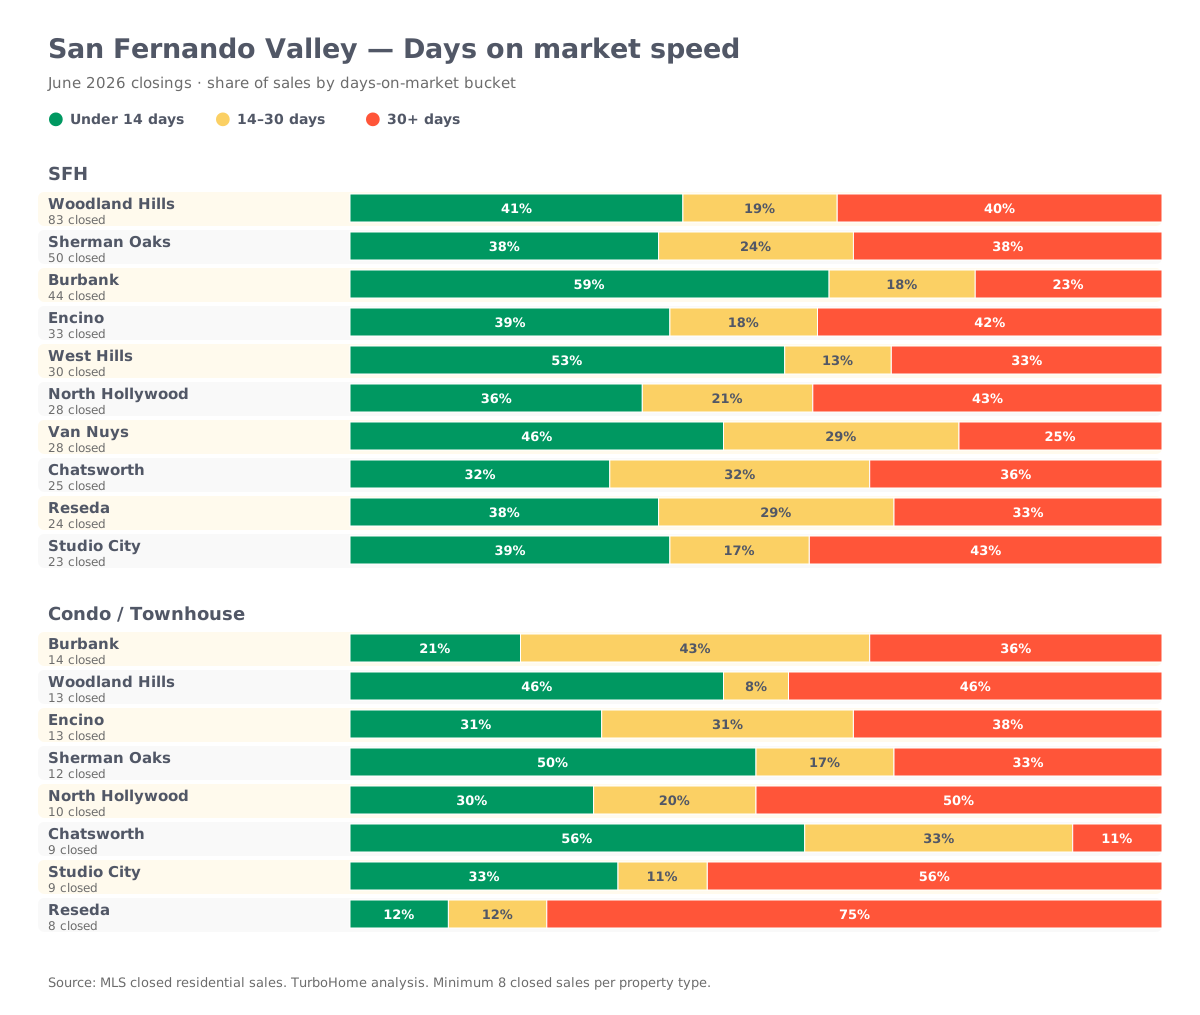
Chatsworth condo closes fast (56% under 14 days) despite the Valley’s condo stock generally lagging SFH. West Hills and Burbank SFH also skew fast. Encino and Sherman Oaks show more 30+ day concentration, tracking with their weaker price-to-list showing.
San Gabriel Valley / Pasadena
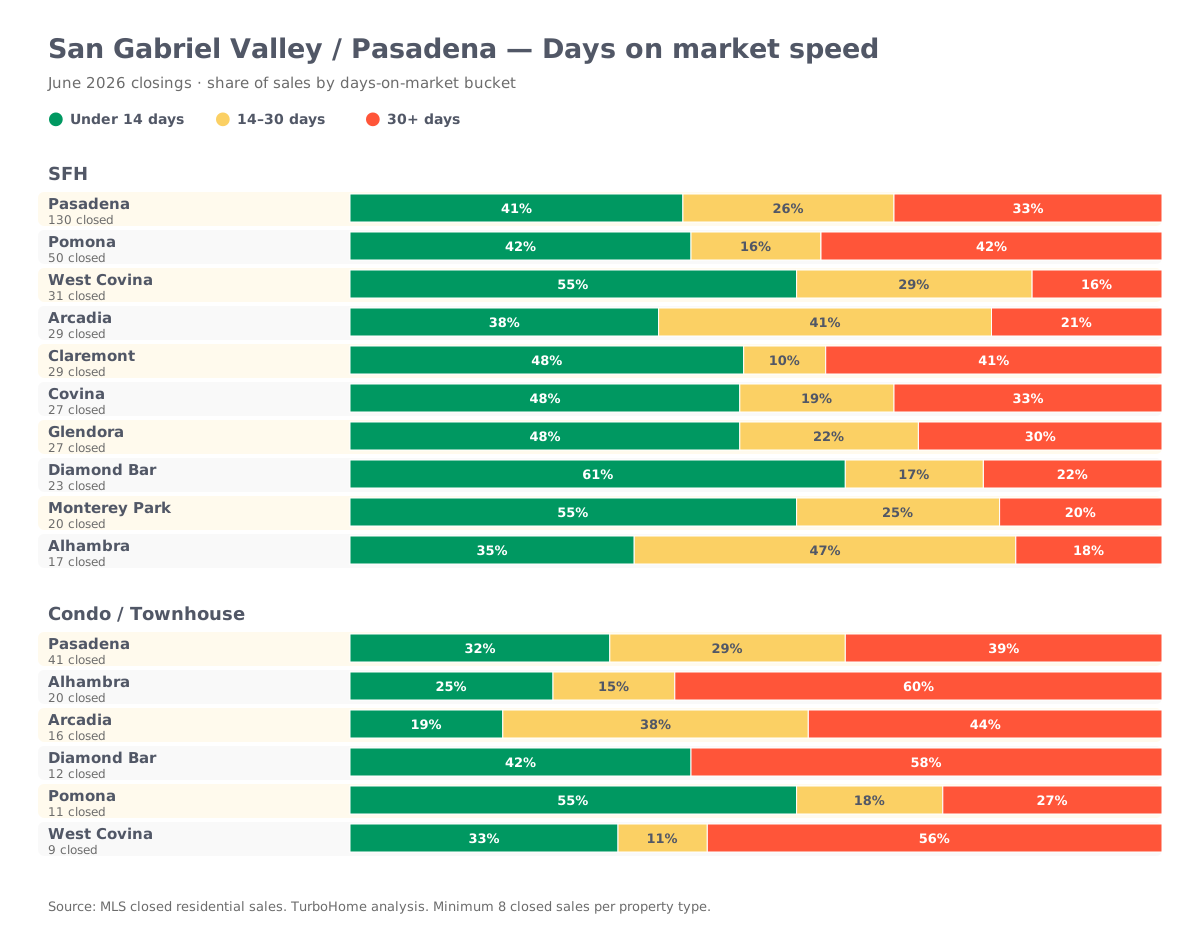
Diamond Bar and West Covina SFH both move quickly, reinforcing this zone’s overall strength story. Covina condo, however, is one of the slowest pockets in the entire dataset, with a heavy 30+ day skew on a thin sample, worth treating as directional rather than definitive given the volume.
Central LA
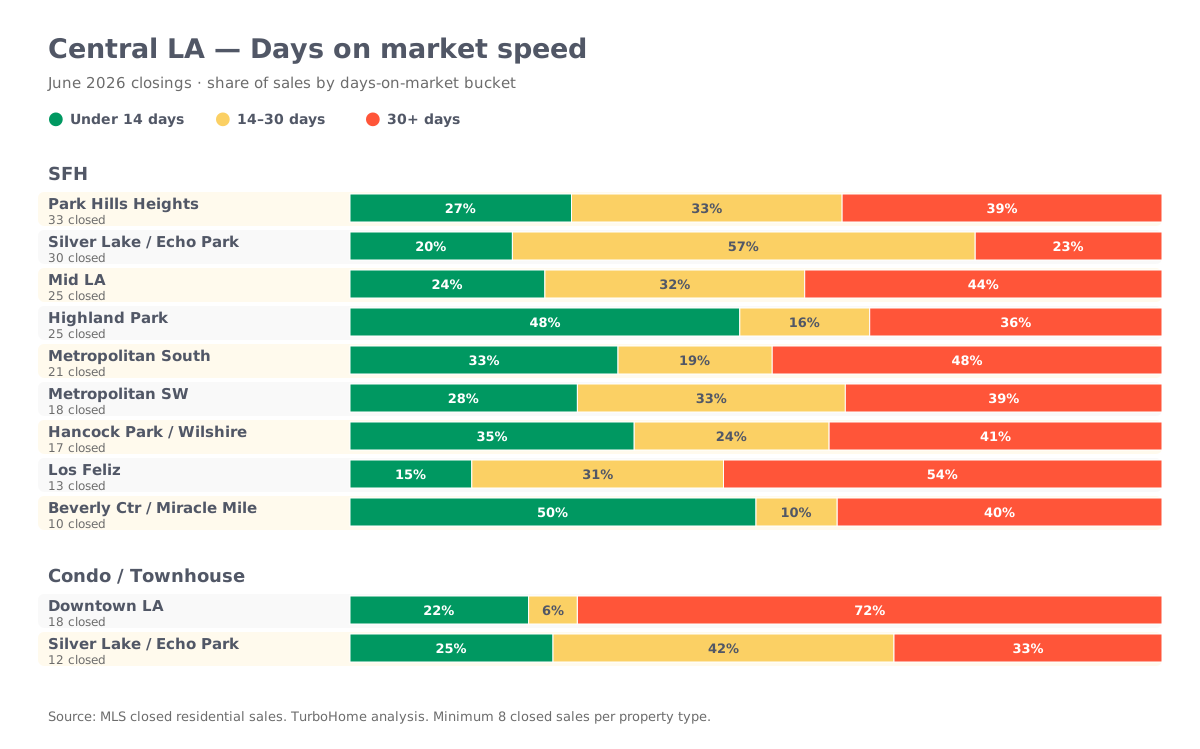
Silver Lake/Echo Park SFH backs up its price strength with speed. Downtown LA condo and Mid LA condo both skew heavily toward 30+ days (72–75%+), the slowest pockets in the zone and consistent with their weak price-to-list numbers.
Where SFH and condo diverge most within the same city: Westwood/Century City has the widest price-to-list gap of any single city in the dataset: SFH +2.9% over list (12 closed) vs. condo −3.4% under (34 closed). The speed data backs this up. Westwood/Century City SFH moves fast (only 17% sit 30+ days) while its own condo market drags (53% sit 30+ days). Reseda and Alhambra show the same pattern even more sharply, with condo in both cities more than 40 percentage points more likely to sit 30+ days than SFH in the identical city. Chatsworth is the one neighborhood in the dataset where this flips: SFH is more likely to sit 30+ days (36%) than its own condo stock (11%).
$/sqft trend: what’s actually appreciating
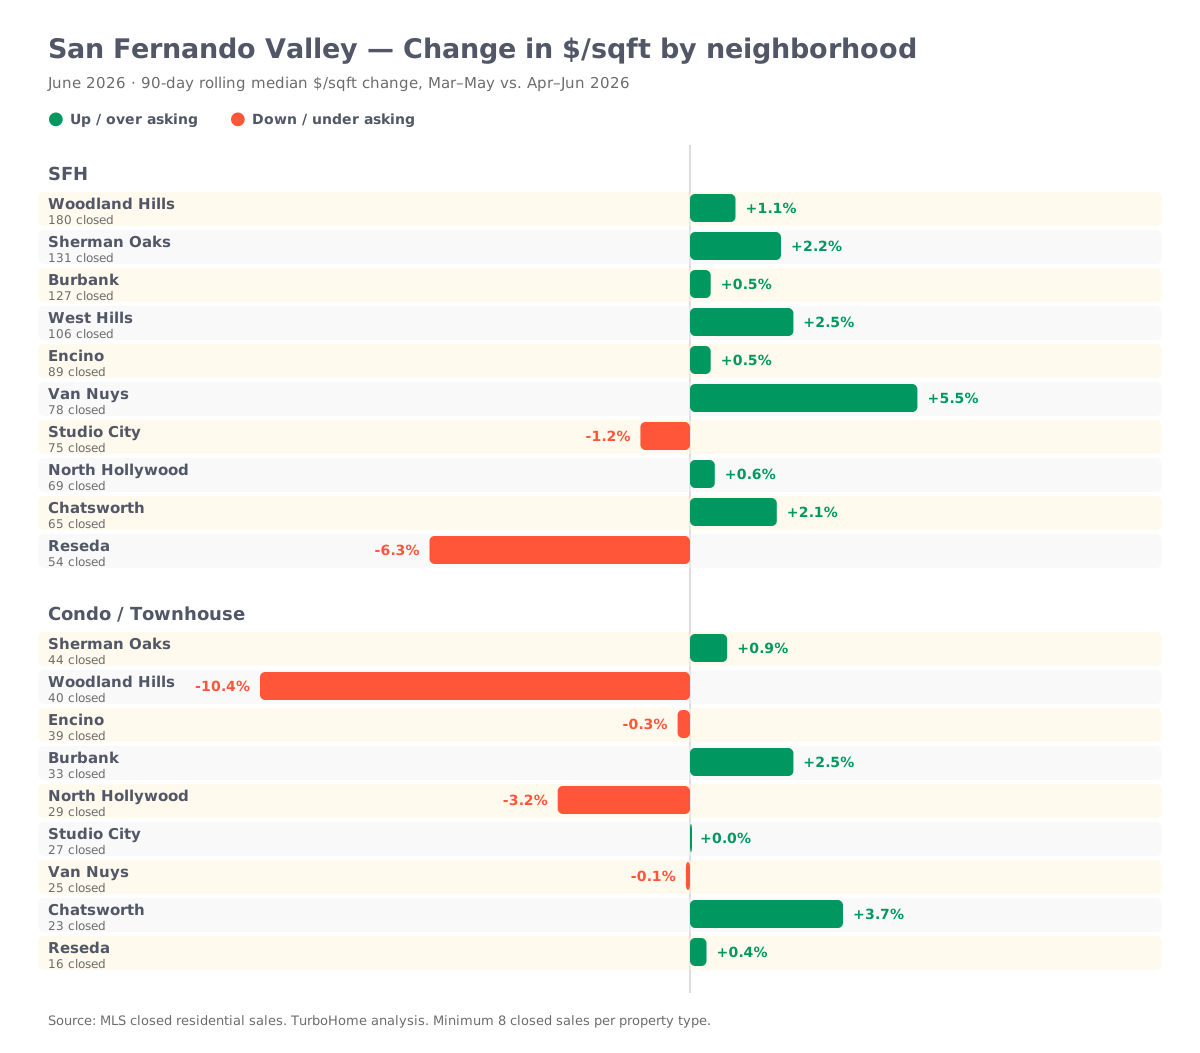
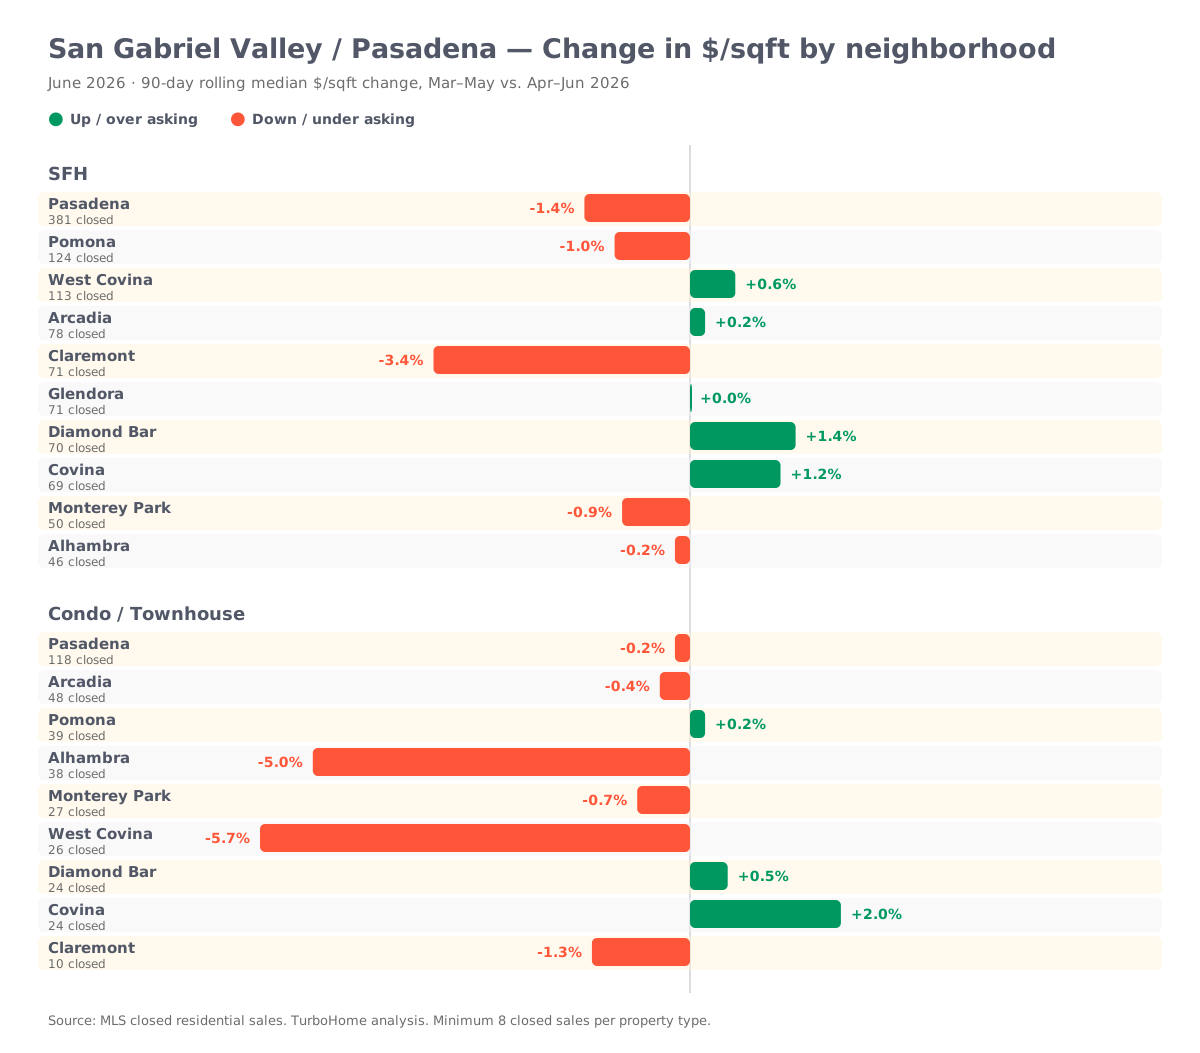
Price-to-list and speed tell you about competition for what’s on the market. $/sqft trend tells you about actual value movement. Below, the percent change in median $/sqft between a March–May 2026 rolling window and an April–June 2026 rolling window, by city/neighborhood. Large swings (8%+) on fewer than 25 sales in one or both windows may reflect a handful of unusual sales rather than a genuine market move.
Westside
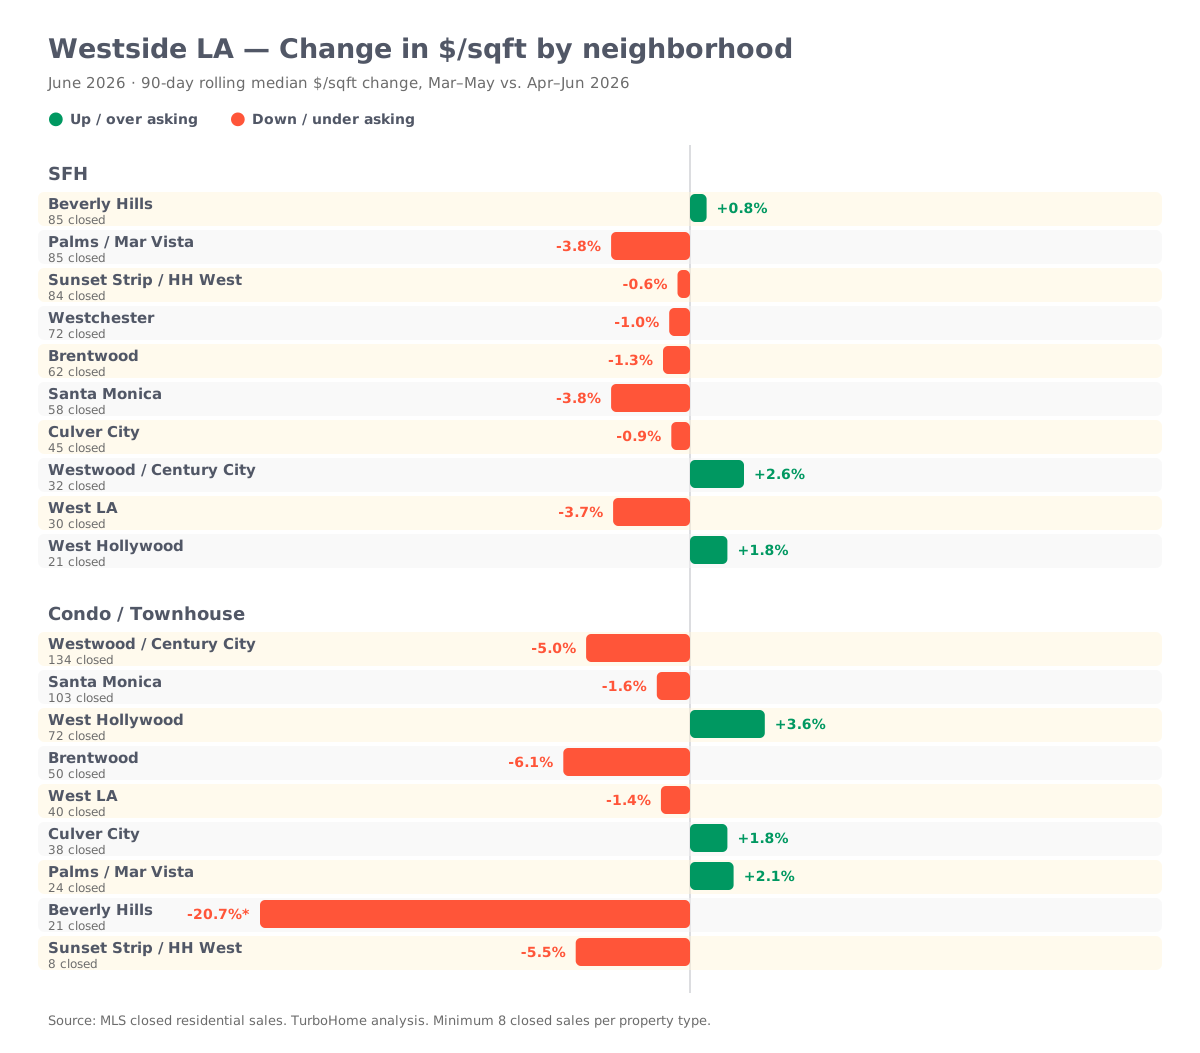
Beverly Hills condo shows the sharpest single move in the dataset at roughly −20.7%, but on a thin sample. Treat it as a data point worth watching, not a confirmed trend.
South Bay
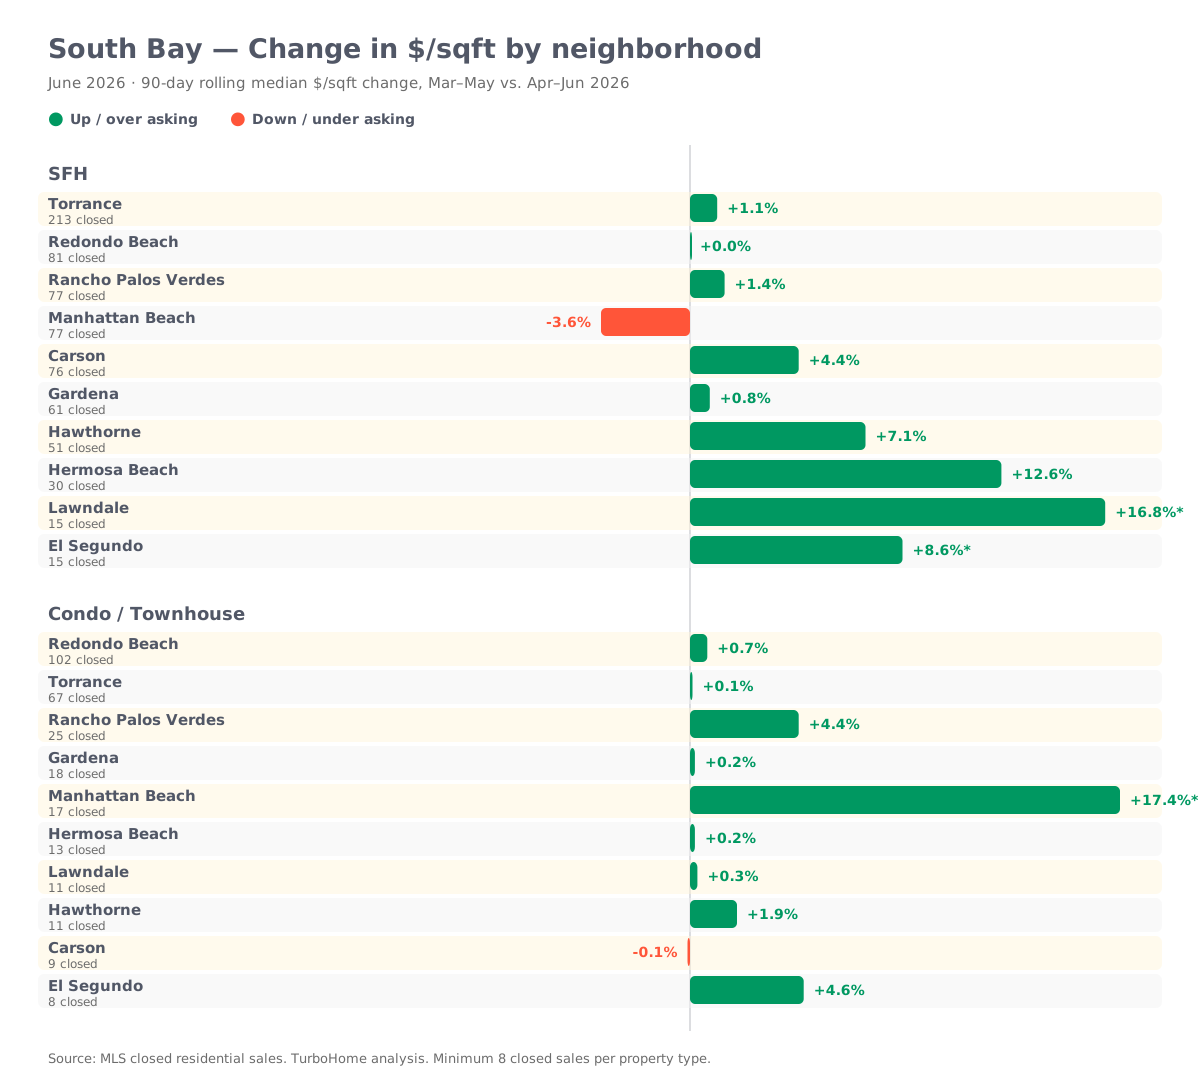
South Bay’s zone-level condo $/sqft showed roughly +4.6% month-over-month, which on its face reads like real appreciation. Broken out by city, it’s flat almost everywhere: Torrance +0.1%, Gardena +0.2%, Carson −0.1%, Redondo Beach +0.7%. That’s a mix-shift artifact (more closings coming from pricier cities within the zone), not actual price movement. This is exactly the kind of thing a zone-level number will hide.
San Fernando Valley
San Gabriel Valley / Pasadena
Central LA
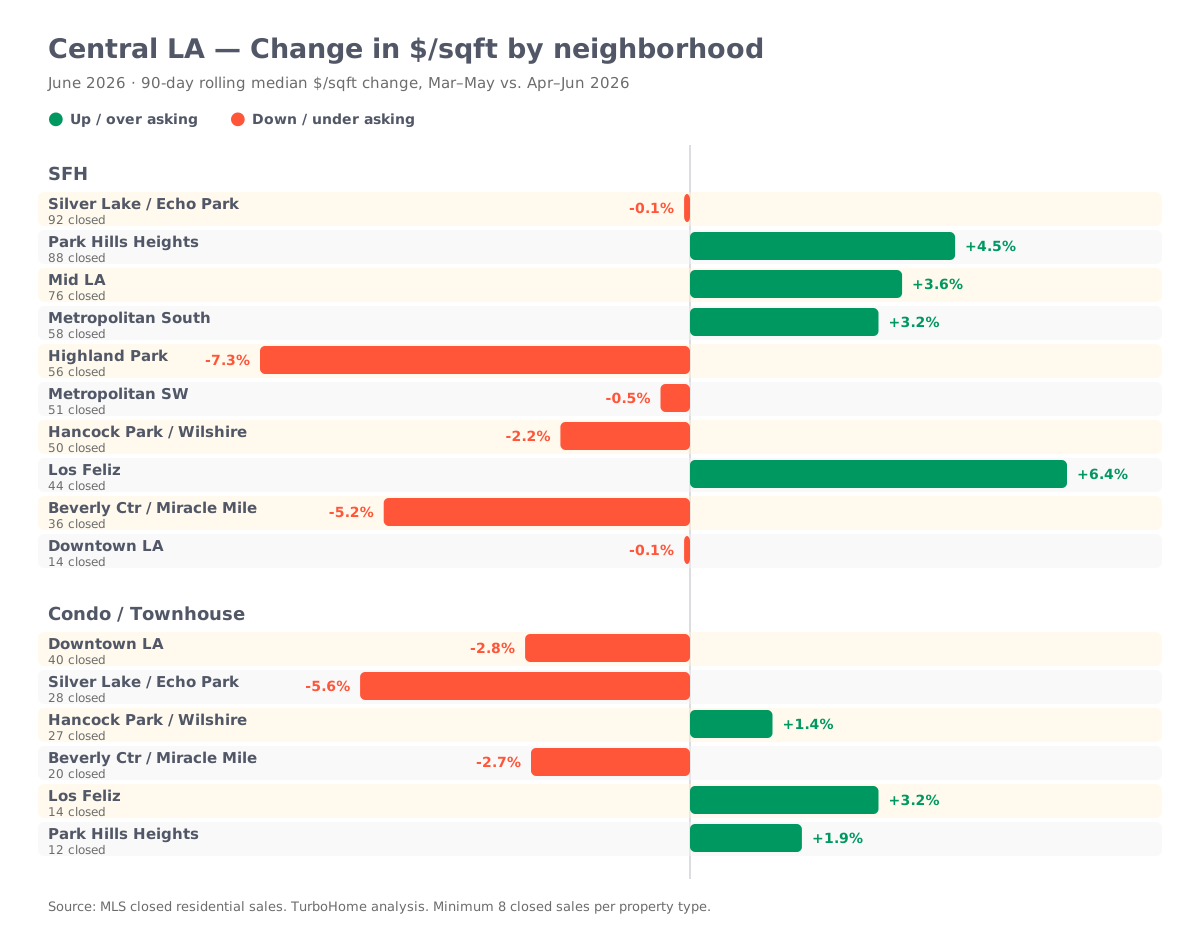
Central LA condo is more mixed than a single zone number suggests: Silver Lake/Echo Park (−5.6%), Downtown LA (−2.8%), and Beverly Center/Miracle Mile (−2.7%) are down, while Park Hills Heights (+1.9%), Hancock Park/Wilshire (+1.4%), and Los Feliz (+3.2%) are up. The zone’s negative headline number is being driven by its highest-volume neighborhoods trending down, not by uniform weakness. On the Westside, Beverly Hills condo shows the sharpest single move in the dataset at roughly −20.7%, but on only 19–21 total sales across the two comparison windows, which is exactly the kind of thin-sample swing to treat as directional. Treat it as a data point worth watching, not a confirmed trend.
Some cities that appear in the price-to-list and DOM charts don’t appear in the $/sqft charts. That’s not an oversight, it means one or both property types in that city had too few sales in a given 90-day window to produce a reliable median.
What this means if you’re buying or selling in LA County
Selling in a hot pocket
If you’re selling in a hot neighborhood pocket (Silver Lake/Echo Park, Highland Park, Hermosa Beach, Culver City), the zone-level average likely understates your leverage. These pockets are closing meaningfully over list and fast, and pricing to the zone average would leave money on the table.
Selling condo in a soft pocket
If you’re selling condo in a soft pocket (Downtown LA, West Hollywood, Beverly Hills), the zone number likely overstates your position. Price and marketing strategy should reflect the specific neighborhood’s slower DOM and steeper list-price discount, not the zone blend.
Buying and negotiating room
The DOM buckets are the more actionable read than price-to-list alone. A neighborhood with a high concentration of 30+ day listings (West Hollywood condo, Encino, Covina condo) is where negotiating room actually exists, even in a zone that looks tight or balanced on paper.
SFH vs. condo, same city
Don’t assume they move together. Westwood/Century City, Reseda, and Alhambra all show SFH and condo pulling in opposite directions on both price and speed within the identical city boundary. What’s true for one property type in a neighborhood isn’t automatically true for the other.
Methodology notes
- Source: MLS, closed residential sales.
- Price-to-list and DOM window: June 2026 closings only.
- $/sqft window: 90-day rolling medians, comparing March–May 2026 to April–June 2026.
- Cleaning: Removed listings with sale-to-list ratios outside 50–200% and sale prices under $100k (data-entry outliers).
- Minimum sample size: 8 closed sales per property type per city/neighborhood to appear in any chart. Categories below this threshold are omitted rather than shown with an unreliable figure.
- Outlier flagging: $/sqft changes of 8%+ on fewer than 25 total sales across both comparison windows should be read as directional, not confirmed.
- Zone definitions: Westside, South Bay, San Fernando Valley, San Gabriel Valley/Pasadena, and Central LA, as defined by MLS area groupings. Top 10 cities/neighborhoods per zone selected by June 2026 closing volume.
- MLS attribution: Data in this report is derived from MLS closed-sale records (The MLS/CLAW and CRMLS feeds via the AnyProp RESO-compliant data platform) and is provided for informational purposes only. It has not been independently verified by the Multiple Listing Service and may differ from figures published directly by MLS associations due to differing cutoff dates, cleaning rules, or geographic groupings.
Sources & further reading
The figures above come from closed MLS transaction data. For broader context and independent corroboration of LA County-wide trends referenced in this report, see:
- Greater Los Angeles REALTORS®, June 2026 Market Analysis: The MLS/CLAW-reported median SFH sale price ($1,060,000, 16 median DOM) and condo figures ($685,000, 29 median DOM) for the same period.
- Redfin, Los Angeles County Housing Market: County-wide days-on-market, sale-to-list, and price trend data based on MLS and public records.
- Realtor.com, Los Angeles County Housing Market Report: Median days-on-market, listing prices, inventory, and year-over-year trend data.
- California Association of REALTORS®, June Home Sales and Price Report: Statewide, regional, and Los Angeles County median price, inventory, sales, and days-on-market benchmarks.
- Zillow, Los Angeles County Home Values: Typical home value and median days-to-pending trend data.
These third-party sources reflect their own methodologies and reporting windows and may not match TurboHome’s neighborhood-level breakdown exactly. They are included as independent points of reference, not as the underlying data for this report.
Frequently asked questions
Is the LA County housing market favoring single-family homes or condos?
In every zone analyzed, single-family homes closed closer to or above asking price and moved faster than condos and townhouses in the same market.
Which LA County neighborhood had the strongest price-to-list result in June 2026?
Silver Lake and Echo Park single-family homes had the strongest result in the dataset at 6.0% over final list price, followed by Highland Park at 5.3% over list.
Which LA County market moved fastest in June 2026?
Hermosa Beach single-family homes were the fastest-moving pocket in the dataset, with 83% of June closings taking under 14 days.
Where did LA County buyers have the most negotiating room?
Negotiating room concentrated in neighborhoods with a high share of 30-plus-day closings, including West Hollywood condos, Encino, Covina condos, Downtown LA condos, and Mid LA condos.
Why can LA County zone averages be misleading?
Zone averages can hide 5–10 percentage point swings between nearby neighborhoods and can conceal single-family homes and condos moving in opposite directions within the same city.
What was the minimum sample size for this analysis?
A city or neighborhood needed at least eight closed sales for a property type to appear in a chart. Categories below that threshold were omitted.
Want the same breakdown for your neighborhood?
TurboHome pulls this same MLS data for every California market we operate in. If you’re deciding when to list, how to price, or whether a specific offer makes sense against what’s actually closing nearby, we can run the numbers for your address.
About the Author
Vinura Abeysundara
Vinura Abeysundara is a real estate and growth professional with experience scaling homebuying platforms across Canada and the United States. Formerly Head of Growth at Zown, he now works with TurboHome and writes about homebuyer savings, flat-fee real estate, commissions, and technology in real estate.
View Vinura on LinkedInAbout Kevin Kretzmer
Head Agent, California
Kevin Kretzmer leads TurboHome's California agent team and reviews California and national buyer guidance for practical brokerage accuracy.
View Kevin's profile